600% Average Upside Potential. Do you own this Multibagger from the Communication Services Sector?


Introduction
In the dynamic landscape of digital marketing, Brightcom Group Ltd, formerly known as Lycos Internet Ltd, stands as a stalwart, providing innovative solutions to businesses, agencies, and online publishers worldwide since its inception in 2010.
Services That Illuminate the Digital Realm
Brightcom Group operates across three major divisions, showcasing a diverse range of services:
a. Ad-Tech and Digital Marketing:
From Video Advertising to Mobile Marketing, the company pioneers in a spectrum of services, including Performance-based Marketing, Email Marketing, and Digital Traffic Management. Their prowess extends to Niche Campaigns, Ad Serving, and the ever-evolving landscape of Social Marketing.
b. Software Services:
The company's software services focus on developing customized technology platforms tailored to meet the specific needs of clients, primarily in the realm of digital media.
c. Future Technologies:
Brightcom Group delves into the future with its LIFE product and explores advancements in artificial intelligence, machine learning, and the innovative Digital Out of Home (DOOH) advertising space.
Clientele that Defines Excellence
With a client base spanning end-to-end advertisers, agencies, and publishers, Brightcom Group's roster includes industry giants like Yahoo, Google, American Express, Unilever, and more.
Diverse Industries, Robust Portfolio
Catering to industries ranging from Media & Entertainment to BFSI, the company's product portfolio boasts an array of offerings through subsidiaries such as Onetag, Coreg, Volomp, and more.
Global Footprint, Local Innovation
While the company's software development services are rooted in India, Brightcom Group's global presence extends to 25 office locations worldwide, with recent expansions into Berlin and ventures into Quantum Computing Innovation labs.
Financial Insights and Expansion Ventures
In FY22, the company witnessed substantial revenue contributions from North America (52%), South America (20%), Europe & the Middle East (17%), Asia (7%), and Australia (4%). Noteworthy expansions include the establishment of the 25th global office in Berlin and investments in a Quantum Computing Innovation lab.
Strategic Acquisitions and Joint Ventures
Brightcom Group remains at the forefront of industry trends with strategic moves, including the recent signing of a Letter of Intent to acquire a US-based digital audio company. Additionally, a joint venture named Brightcom Audio US, LLC, formed with Consumable, Inc., amplifies the company's prowess in the realm of Audio Advertising Solutions.
Navigating Challenges with Transparency
In the pursuit of transparency and regulatory adherence, Brightcom Group is undergoing a Forensic Audit ordered by SEBI, focusing on financial statements from FY 2014-15 to FY 2019-20.
As we embark on an exploration of Brightcom Group, this introduction unveils a company poised at the intersection of innovation and industry leadership, navigating the digital frontier with a commitment to excellence, strategic expansion, and cutting-edge solutions.
Growth, Profitability, and Efficiency (GPE) Analysis of Brightcom Group
In the dynamic landscape of the stock market, a thorough analysis of Growth, Profitability, and Efficiency (GPE) is paramount for investors. Let's delve into Brightcom Group's performance in these crucial domains, providing insights into its trajectory and standing relative to its peer group.
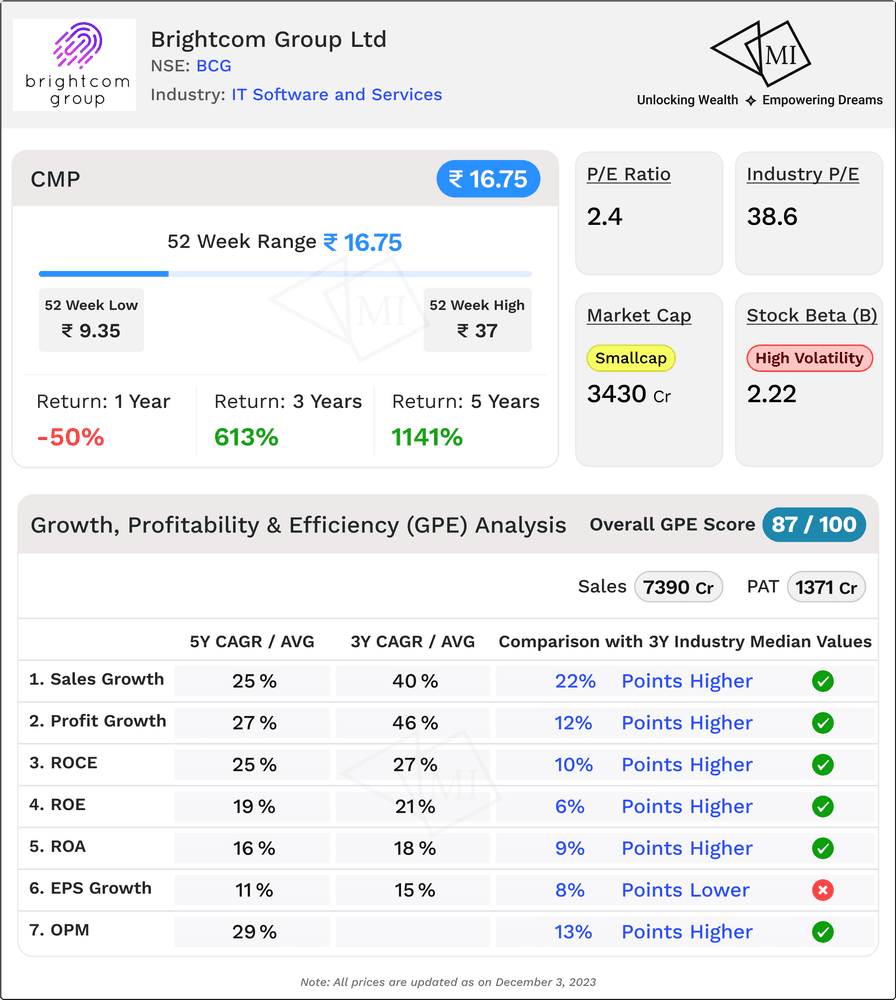
1. Sales Growth: Soaring Above Peer Averages
- Sales 3Y CAGR (40%): Brightcom Group has exhibited an impressive 40% Compound Annual Growth Rate over the past three years, significantly outshining its peer group by a substantial 22 percentage points.
- Sales 5Y CAGR (25%): The trend continues over a five-year period, with a robust 25% CAGR, showcasing a consistent growth pattern that surpasses the peer group median by 10 percentage points. This signals a proactive and thriving market presence.
2. Profits: A Beacon of Prosperity
- Profits 3Y CAGR (46%): The profitability landscape for Brightcom Group is robust, boasting a 46% CAGR in profits over the last three years. This figure stands 12 percentage points higher than the median of its peer group, exemplifying effective financial management and operational efficiency.
- Profits 5Y CAGR (27%): Over a five-year span, the 27% CAGR in profits further underscores the company's ability to generate sustained financial gains, maintaining a lead of 9 percentage points above the peer group median.
3. Return on Capital Employed (ROCE): Maximizing Efficiency
- ROCE 3Y Avg (27%): Brightcom Group has consistently delivered a Return on Capital Employed averaging at an impressive 27% over the past three years. This figure stands 10 percentage points higher than the peer group median, reflecting efficient capital utilization.
- ROCE 5Y Avg (25%): The five-year average ROCE of 25% continues to demonstrate the company's prowess in capital efficiency, maintaining an 8 percentage point lead over its peers.
4. Return on Equity (ROE): Rewarding Shareholders
- ROE 3Y Avg (21%): Shareholders have enjoyed a higher return, with a three-year average ROE of 21%, surpassing the peer group median by 6 percentage points.
- ROE 5Y Avg (19%): The five-year average ROE of 19% reinforces the company's commitment to shareholder value, maintaining a lead of 7 percentage points over the peer group median.
5. Return on Assets (ROA): Maximizing Asset Efficiency
- ROA 3Y Avg (18%): Brightcom Group has demonstrated effective asset utilization with a three-year average ROA of 18%, standing 9 percentage points higher than the peer group median.
- ROA 5Y Avg (16%): The five-year average ROA of 16% further solidifies the company's commitment to maximizing asset efficiency, maintaining a lead of 9 percentage points.
6. Earnings per Share (EPS) Growth: Sustaining Momentum
- EPS 3Y Growth (15%): The EPS growth, while at a commendable 15%, is 8 percentage points lower than the peer group median, signalling an area where further attention and strategic initiatives may be considered.
- EPS 5Y Growth (11%): Over a five-year horizon, the 11% EPS growth, while strong, remains 4 percentage points below the median of the peer group.
7. Operating Margin: A Margin Above the Rest
- Operating Margin 5Y Avg (29%): Brightcom Group has maintained an impressive average operating margin of 29% over the past five years, standing 13 percentage points higher than the peer group median. This underscores the company's efficiency in managing operational costs.
In conclusion, with a GPE Score of 87 on 100, Brightcom Group emerges as a formidable player in the market, showcasing robust growth, profitability, and efficiency metrics that often surpass its peer group. While certain areas like EPS growth may warrant strategic attention, the overall GPE analysis positions Brightcom Group as a promising investment prospect in the competitive landscape.
Fundamental Analysis (FA) of Brightcom Group
In the ever-evolving world of stock markets, understanding the fundamental aspects of a company is crucial for investors seeking informed decisions. Let's embark on a journey of Fundamental Analysis for Brightcom Group, unravelling key indicators and potential implications for the stock's future.
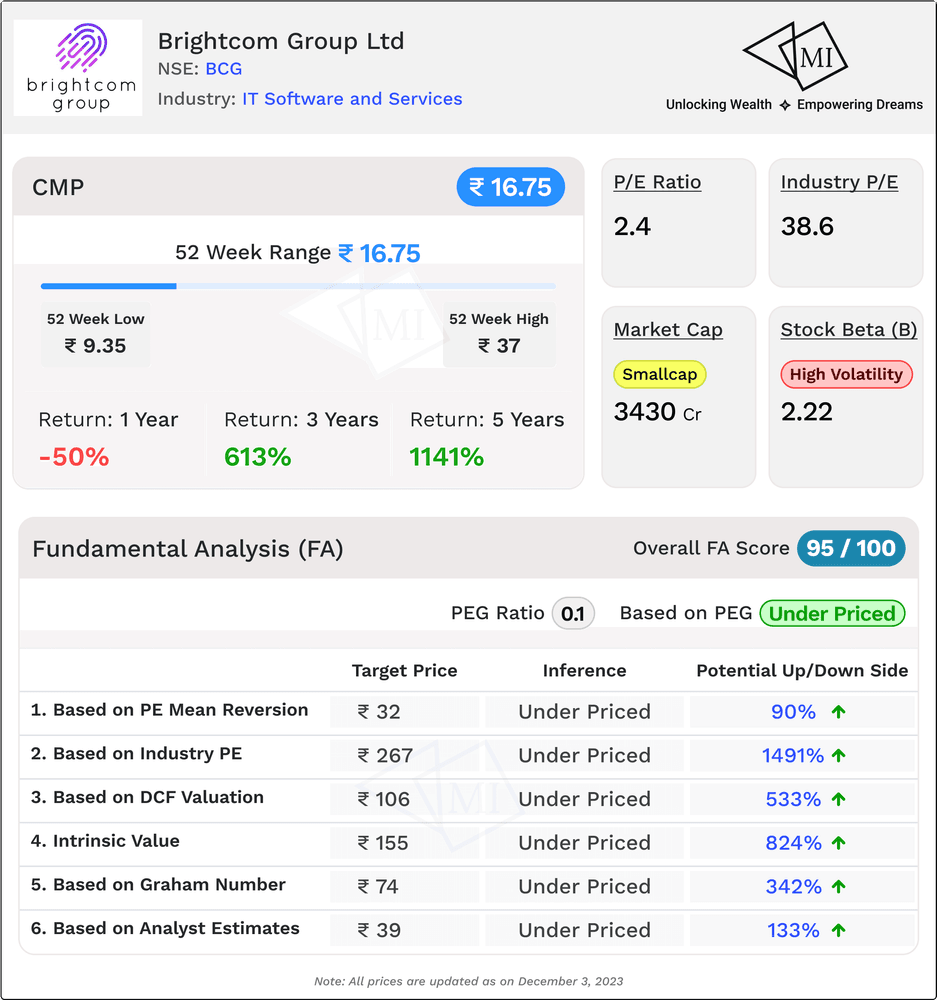
Current Market Price: INR 16.75
Before delving into the analysis, let's establish the current market scenario with Brightcom Group's stock trading at INR 16.75.
PEG Ratio: 0.1 - An Underpriced Gem
The Price/Earnings to Growth (PEG) ratio, standing at an impressive 0.1, suggests that Brightcom Group's stock is potentially underpriced. This ratio, which considers both the P/E ratio and the earnings growth rate, indicates a compelling investment opportunity.
Expected Share Price Scenarios: A Landscape of Potential Upsides
1. Expected Price based on PE Mean Reversion: INR 32 (Potential Upside of 90%)
The calculated share price based on PE Mean Reversion strategy paints a picture of substantial underpricing, with a potential upside of 90%.
2. Expected Price based on Industry PE for Brightcom: INR 267 (Potential Upside of 1491%)
Industry comparison suggests an even more staggering potential upside of 1491%, emphasizing the stock's undervaluation relative to industry standards.
3. Fair Value as per DCF Valuation for Brightcom: INR 106 (Potential Upside of 533%)
The discounted cash flow (DCF) valuation indicates a fair value of INR 106, showcasing a remarkable potential upside of 533%.
4. Intrinsic Value (Base Case Scenario) for Brightcom: INR 155 (Potential Upside of 824%)
The intrinsic value assessment points to a compelling potential upside of 824%, further supporting the notion of the stock being underpriced.
5. Fair Value as per Graham Number for Brightcom: INR 74 (Potential Upside of 342%)
The Graham Number calculation positions the stock's fair value at INR 74, reflecting a noteworthy potential upside of 342%.
6. Target Price for Brightcom as per Analyst Estimate: INR 39 (Potential Upside of 133%)
Analyst estimates propose a target price of INR 39, indicating a potential upside of 133%.
Conclusion: Unlocking Investment Potential
In the realm of fundamental analysis, with a FA Score of 95 on 100, Brightcom Group emerges as a compelling investment prospect, with various indicators suggesting significant underpricing. The PEG ratio, coupled with diverse valuation methods, showcases a landscape of potential upsides ranging from 90% to an impressive 1491%.
Investors keen on unlocking hidden gems in the market may find Brightcom Group an intriguing opportunity, backed by a robust fundamental foundation.
Risk and Solvency Analysis (RSA) of Brightcom Group
In the intricate world of investments, understanding the risk and solvency dynamics of a company is paramount for investors seeking a balanced and informed approach. Let's embark on a comprehensive Risk and Solvency Analysis for Brightcom Group, shedding light on critical indicators and emphasizing the Beneish M Score, a key metric in detecting potential manipulation.
1. Stock Beta: 2.22 - Riding the Volatility Wave
- High Volatility Signified: The stock's Beta of 2.22 indicates high volatility, implying that Brightcom Group's share prices may experience larger fluctuations compared to the overall market. Investors should be prepared for a roller-coaster ride in the stock's value.
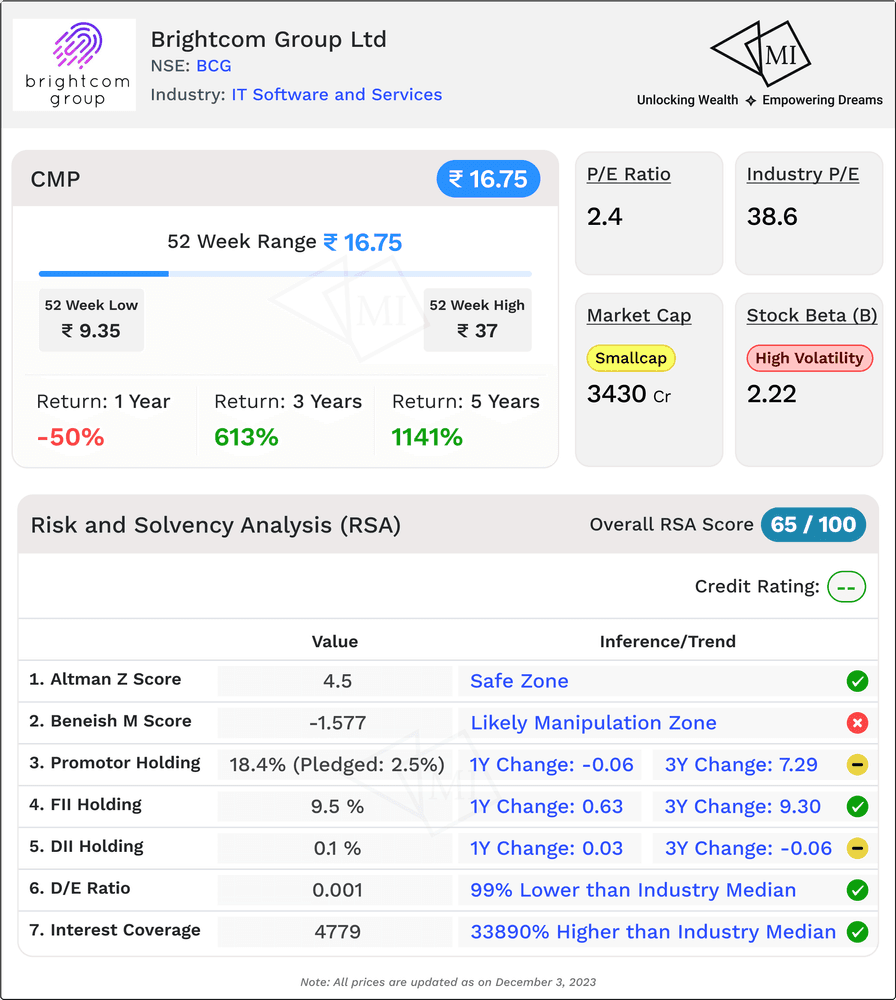
2. Long-Term Credit Rating: NA - A Cautionary Note
- Unavailable Credit Rating: Brightcom Group lacks a long-term credit rating, suggesting a degree of uncertainty about its creditworthiness. Investors should approach with caution, given the absence of a formal credit rating.
3. Altman Z Score: 4.5 - In the Safe Zone
- Robust Financial Health: The Altman Z Score of 4.5 places Brightcom Group comfortably in the safe zone. This metric, which assesses a company's financial health and the likelihood of bankruptcy, indicates a strong and stable financial position.
4. Beneish M Score: -1.58 - A Signal of Caution in Manipulation Zone
- Likely Manipulation Zone: The Beneish M Score of -1.58 raises a cautionary flag. This score, designed to detect the potential manipulation of financial statements, suggests that investors should exercise vigilance and scrutinize financial reports closely.
5. Promoter Holding: 18.4% - Steady Ownership with Pledging
- Promoter Holding Stability: Promoter holding at 18.4% indicates a level of ownership stability. However, the 2.5% pledged suggests that some promoter shares are used as collateral, warranting attention as this may impact decision-making and stock performance.
6. FII, DII Holdings: Strategic Participation
- FII Holding (9.53%): Foreign Institutional Investors (FIIs) holding at 9.53% signifies strategic participation. A positive 1-year change and a significant 3-year change in FII holding reflect confidence and interest from foreign investors.
- DII Holding (0.11%): Domestic Institutional Investors (DIIs) have a minimal 0.11% holding. While the 1-year change is positive, investors should note the marginal involvement of DIIs in the company.
7. D/E Ratio: 0.001 - Exceptionally Low Leverage
- Minimal Debt Exposure: The Debt-to-Equity (D/E) ratio of 0.001 is exceptionally low, positioning Brightcom Group with minimal debt exposure. This figure, 99% lower than the industry median, reflects a conservative and low-leverage financial structure.
8. Interest Coverage Ratio (ICR): 4779 - Exceptional Solvency
- Robust Debt Servicing Capability: The Interest Coverage Ratio (ICR) of 4779 indicates Brightcom Group's exceptional ability to service its debt obligations. This figure, significantly higher than the industry median, showcases strong solvency and financial health.
In conclusion, while Brightcom Group presents a robust financial health, the presence of a high Beneish M Score and the absence of a long-term credit rating warrant cautious consideration. Investors should closely monitor financial statements, corporate governance, and any updates from the company.
Summary and Conclusion: Recap and Final Thoughts on Brightcom Group
As we navigate the complex terrain of stock market investments, an intricate evaluation of Brightcom Group emerges, revealing a multifaceted perspective. Let's distill the essence of our analysis into a comprehensive Summary and Conclusion, encapsulating key scores and insights.
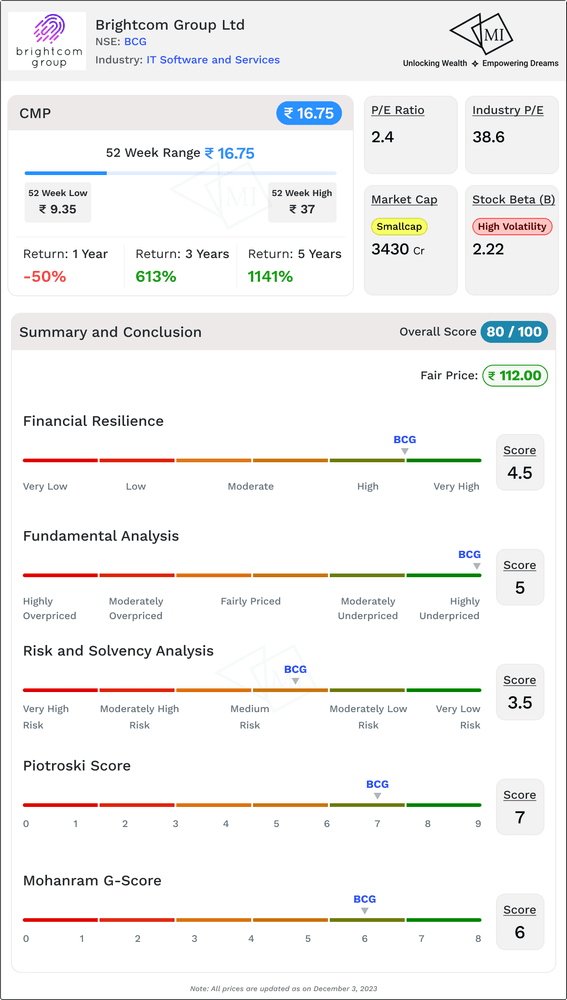
1. Financial Resilience Score: 4.5 on 5
Brightcom Group exhibits commendable financial resilience, scoring an impressive 4.5 out of 5. This underscores the company's robustness in navigating economic fluctuations and maintaining a stable financial footing.
2. Fundamental Analysis Score: 5 on 5
The fundamental analysis paints a compelling picture, with Brightcom Group achieving a perfect score of 5 out of 5. This signifies not only a strong operational performance but also a solid foundation rooted in key financial metrics.
3. Risk and Solvency Analysis Score: 3.5 on 5
While the company demonstrates a satisfactory risk and solvency profile, scoring 3.5 out of 5, there are nuances that warrant attention. The Beneish M Score and the absence of a long-term credit rating introduce elements of caution that investors should heed.
4. Piotroski Score: 7 (High)
Brightcom Group excels in the Piotroski Score, earning a high score of 7. This attests to the company's strong financial position and effective management, instilling confidence in investors regarding its operational and financial health.
5. Mohanram G-Score: 6 (High)
The Mohanram G-Score, standing at an impressive 6, further underscores the company's high standing in terms of financial strength and potential for sustained growth.
Overall Score: 80 on 100
Combining these diverse metrics into an overall score of 80 out of 100, Brightcom Group emerges as a formidable player in the market. This holistic assessment takes into account not only financial performance but also risk management and solvency aspects.
Fair Price for Stock: INR 112 (Current Market Price: INR 16.75)
As we project a fair price for the stock at INR 112, juxtaposed against the current market price of INR 16.75, a stark disparity becomes evident. This discrepancy presents an intriguing opportunity for investors, suggesting that the stock is potentially undervalued.
In conclusion, Brightcom Group, with its stellar financial resilience, robust fundamentals, and high Piotroski and Mohanram G-Scores, stands out as a compelling investment prospect. However, investors are advised to tread cautiously, considering the nuances revealed in the Risk and Solvency Analysis. As with any investment decision, a thorough understanding of the company's financial landscape, coupled with vigilant monitoring, will be key to navigating the dynamic currents of the stock market and unlocking the latent potential that Brightcom Group may hold for astute investors.
Information on Multibagger Investments is for educational purposes only and should not be considered financial advice. Users should conduct their own research and seek professional advice before making investment decisions.