203% Return in 1 Year. Is IRFC share still worth buying?


Introduction
In the grand tapestry of India's economic locomotion, the Indian Railway Finance Corporation (IRFC) emerges as a vital engine, chugging since its inception in 1986. Positioned as the financial lifeblood of the Indian Railways, IRFC dons the cap of a Mini Ratna I and Schedule A Public Sector Enterprise, orchestrating funds from domestic and global Capital Markets.
Key Points: Beyond a mere financial intermediary, IRFC's role extends to financing rolling stock assets, leasing railway infrastructure, and lending to entities under the Ministry of Railways. Its clientele, including Rail Vikas Nigam Ltd and IRCON International Limited, attests to its strategic importance in the railway ecosystem.
Government Linkage: IRFC's tracks are firmly laid in collaboration with the Government of India, with substantial involvement in strategic direction, borrowing, and risk management. The symbiotic relationship safeguards against financial risks, aligning IRFC's journey with the nation's rail aspirations.
Loan Dynamics: While the loan book primarily dances to the rhythm of the Ministry of Railways, FY22's disbursement symphony reveals a strategic allocation - 46% for rolling stock, 53% for railway projects, and 1% for the financial fortification of RVNL.
Financial Symphony: IRFC's financial melody is orchestrated through a diverse borrowing portfolio, including taxable bonds, external commercial borrowings, and rupee term loans. Revenue composition mirrors the intricate balance of interest income, rolling stock, and project assets, illustrating the multifaceted nature of its financial landscape.
Asset Quality and Regulatory Exemption: IRFC's exemption from RBI norms creates a unique narrative, ensuring a pristine history with zero non-performing assets and tax liabilities. This financial buoyancy further positions IRFC as a stable force in the realm of infrastructure financing.
As we delve into the intricacies of IRFC's financial narrative, the upcoming sections will unravel the enigma of its share price target, dissecting the data and projections that shape its future trajectory.
Growth, Profitability, and Efficiency (GPE) Analysis of IRFC
Investing in stocks requires a keen eye for detail, and one of the key tools for evaluating a company's potential is through Growth, Profitability, and Efficiency (GPE) analysis. In this section, we delve into the GPE metrics of Indian Railway Finance Corporation (IRFC) to unravel the story behind its share price targets.
1. Sales Growth: Sailing Ahead of Peers
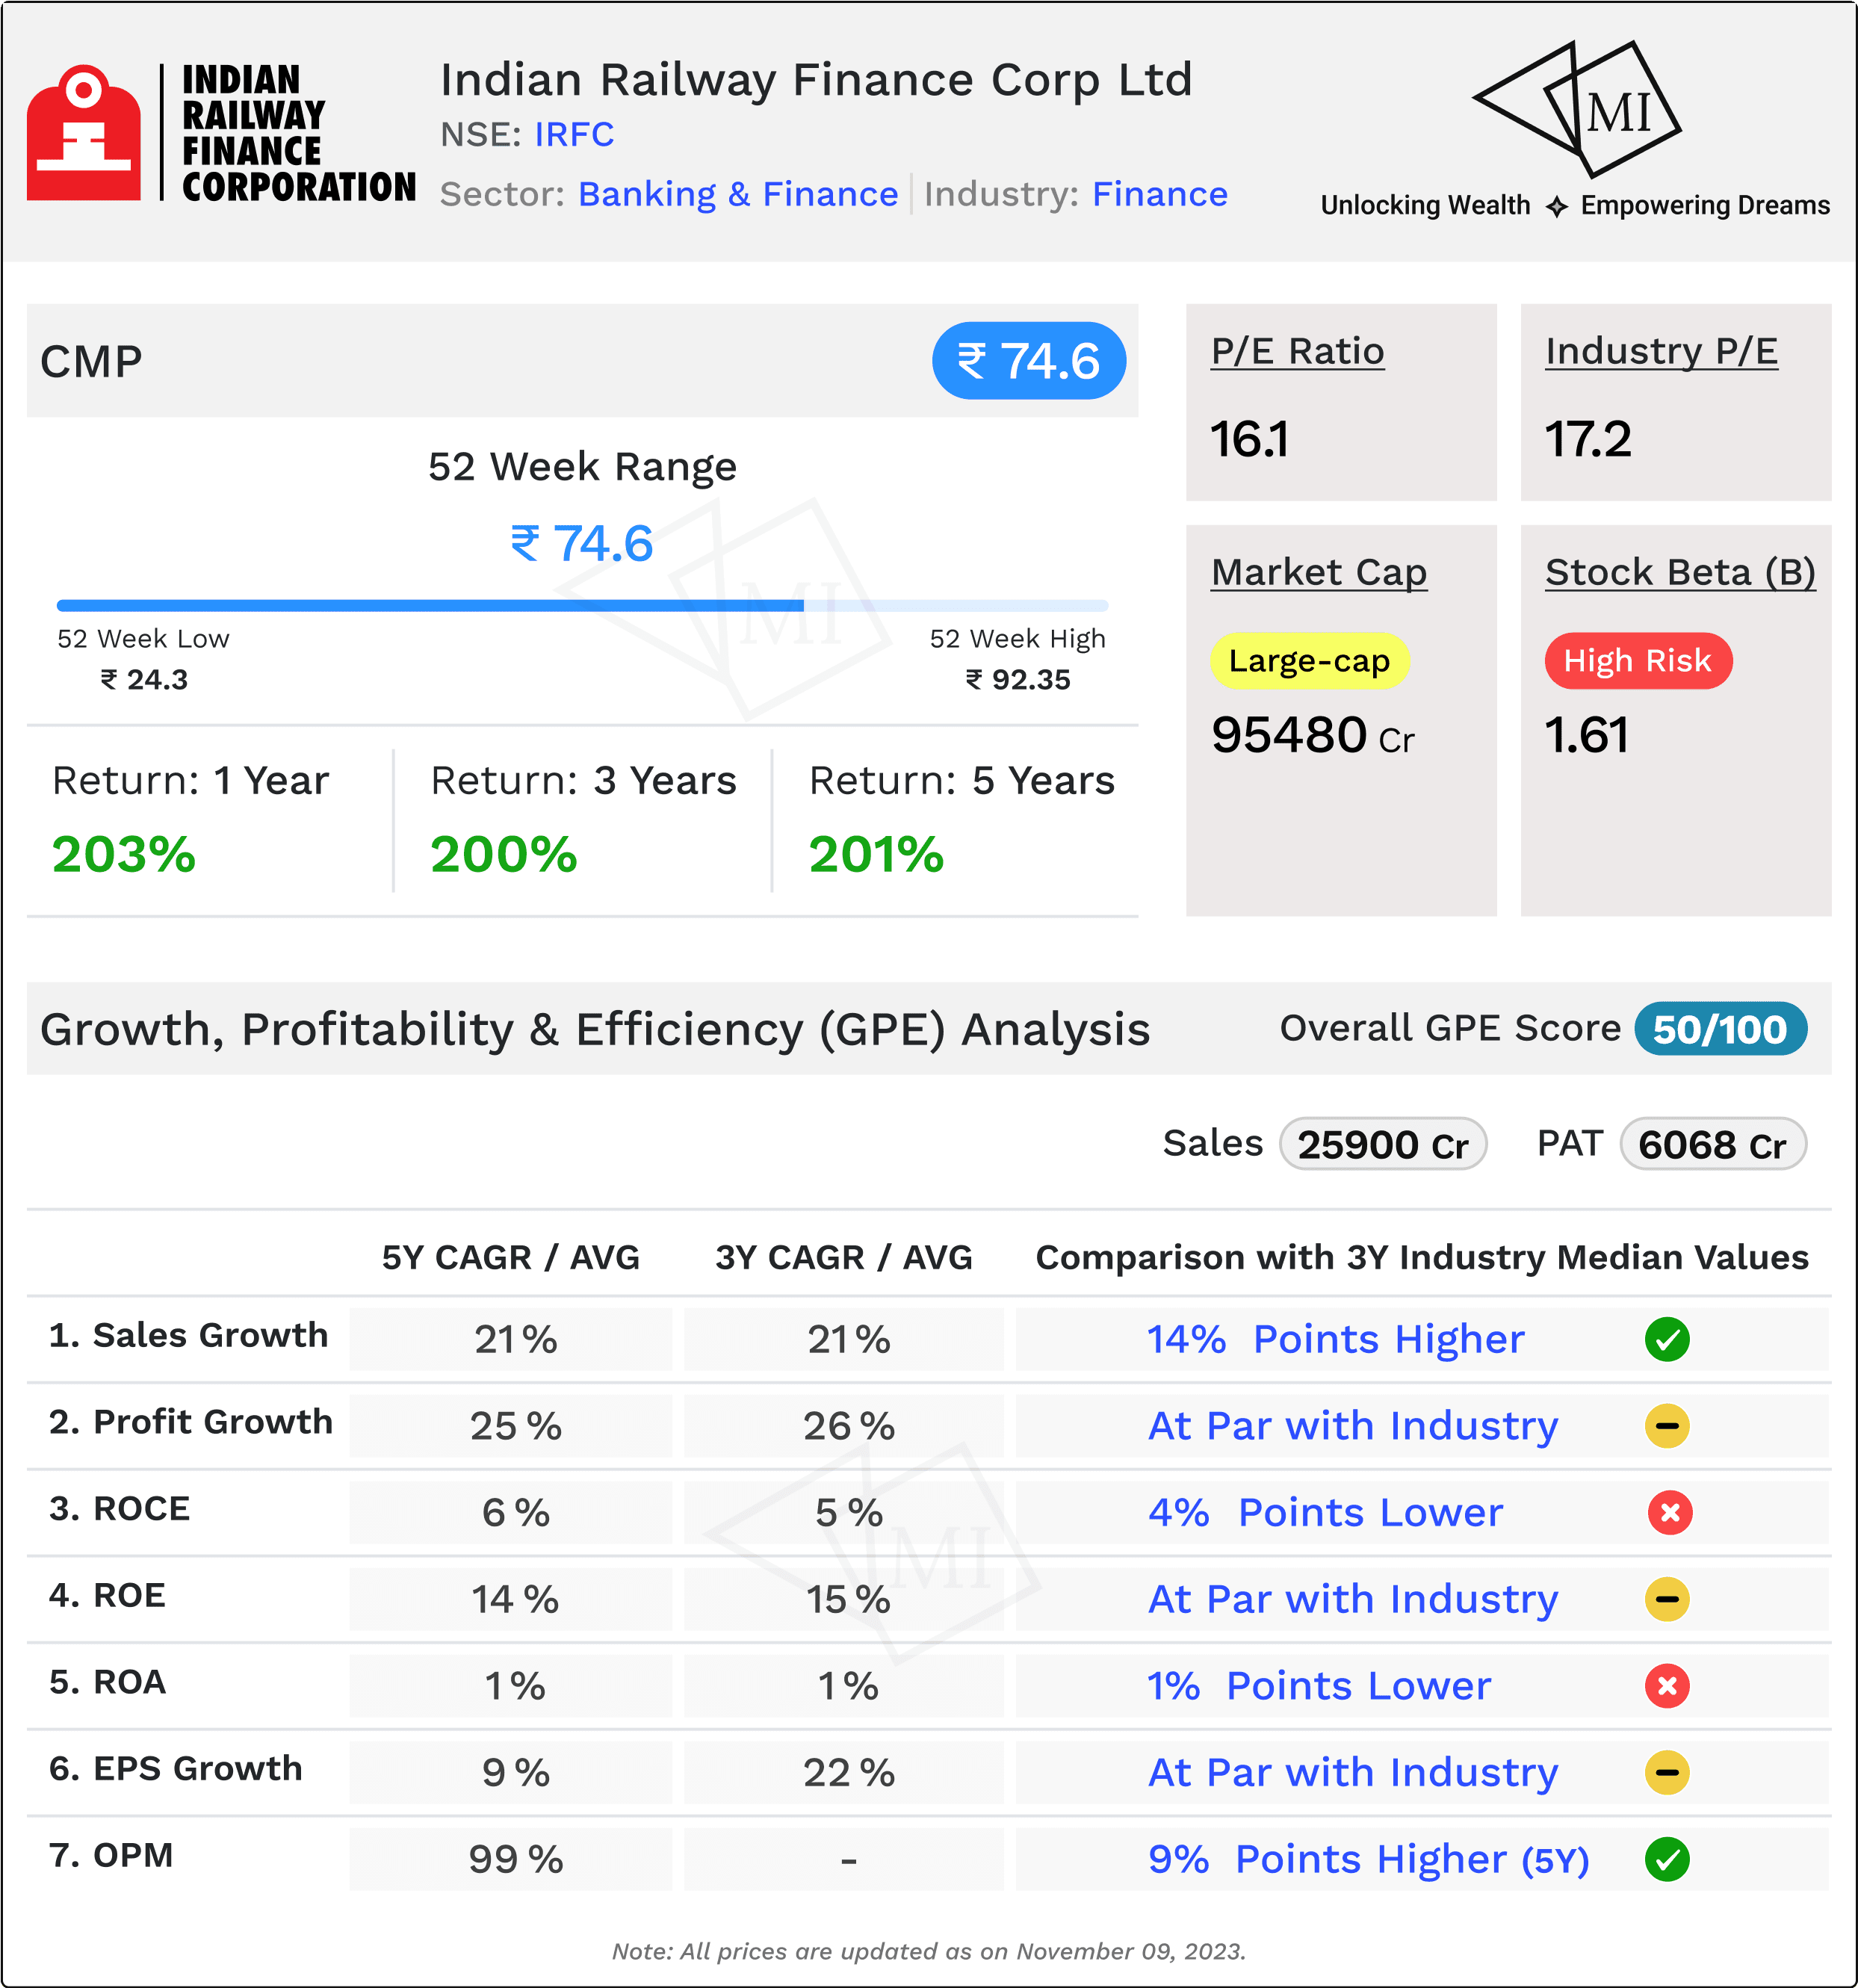
IRFC's Sales Compound Annual Growth Rate (CAGR) over the past 3 years stands at an impressive 21%, outshining its peers by 14%. Even over a 5-year horizon, the company maintains a robust 21% CAGR, surpassing the peer median by 11%. This stellar sales growth showcases IRFC's ability to consistently expand its revenue base, positioning itself as a leader in the market.
2. Profits: Steady Climb with a Competitive Edge
Profits tell a compelling story of IRFC's financial health. The 3-year CAGR of 26% is commendable, matching the median of its peers. Over 5 years, IRFC continues to shine with a 25% CAGR, edging out its peers by 6%. This not only signifies a consistent upward trajectory in profitability but also underlines IRFC's ability to stay ahead in a competitive landscape.
3. Return on Capital Employed (ROCE): Room for Improvement
While IRFC's ROCE over a 3-year and 5-year average is below the median of its peers by 4%, it's crucial to note that the company has been making strategic investments for future growth. The lower ROCE may be indicative of a long-term vision, suggesting that the market might witness a leap in profitability as these investments mature.
4. Return on Equity (ROE): Holding Ground
IRFC's ROE over both 3-year and 5-year averages aligns with the median of its peers, reflecting a balance between risk and reward for shareholders. This stability in returns indicates a consistent performance in generating value for investors.
5. Return on Assets (ROA): A Slight Lag
The ROA of IRFC, trailing behind the median of peers by 1%, suggests room for improvement in utilizing assets more efficiently. However, given the nature of IRFC's business, where assets are predominantly financial in nature, this metric needs to be interpreted in light of the company's unique operational dynamics.
6. Earnings Per Share (EPS): Holding the Line
With a 22% growth in EPS over the past 3 years, IRFC matches the median of its peers. However, the 5-year growth of 9%, while still commendable, lags behind the peer median by 5%. Investors should scrutinize the factors contributing to this discrepancy to gauge the sustainability of future earnings growth.
7. Operating Margin: Scaling Heights
IRFC's 5-year average operating margin is an impressive 99%, surpassing the median of peers by 9%. This high operating margin indicates efficiency in cost management and a strong position in the market.
Conclusion: A Beacon of Growth Amidst Competition
In the realm of finance and investment, IRFC emerges as a compelling contender. Its robust sales growth, competitive profitability, and efficient operational management make it a standout performer in the sector. While certain metrics, such as ROCE and ROA, suggest areas for improvement, the overall trajectory indicates a company poised for future success.
Fundamental Analysis (FA) of IRFC
In the dynamic realm of stock markets, investors often find themselves at a crossroads, seeking the compass of Fundamental Analysis to navigate through the complexities of share prices. Let's embark on a journey into the heart of IRFC (Indian Railway Finance Corporation) through a fundamental lens, deciphering the numbers and projections that shape its financial narrative.
Current Market Price and PEG Ratio:
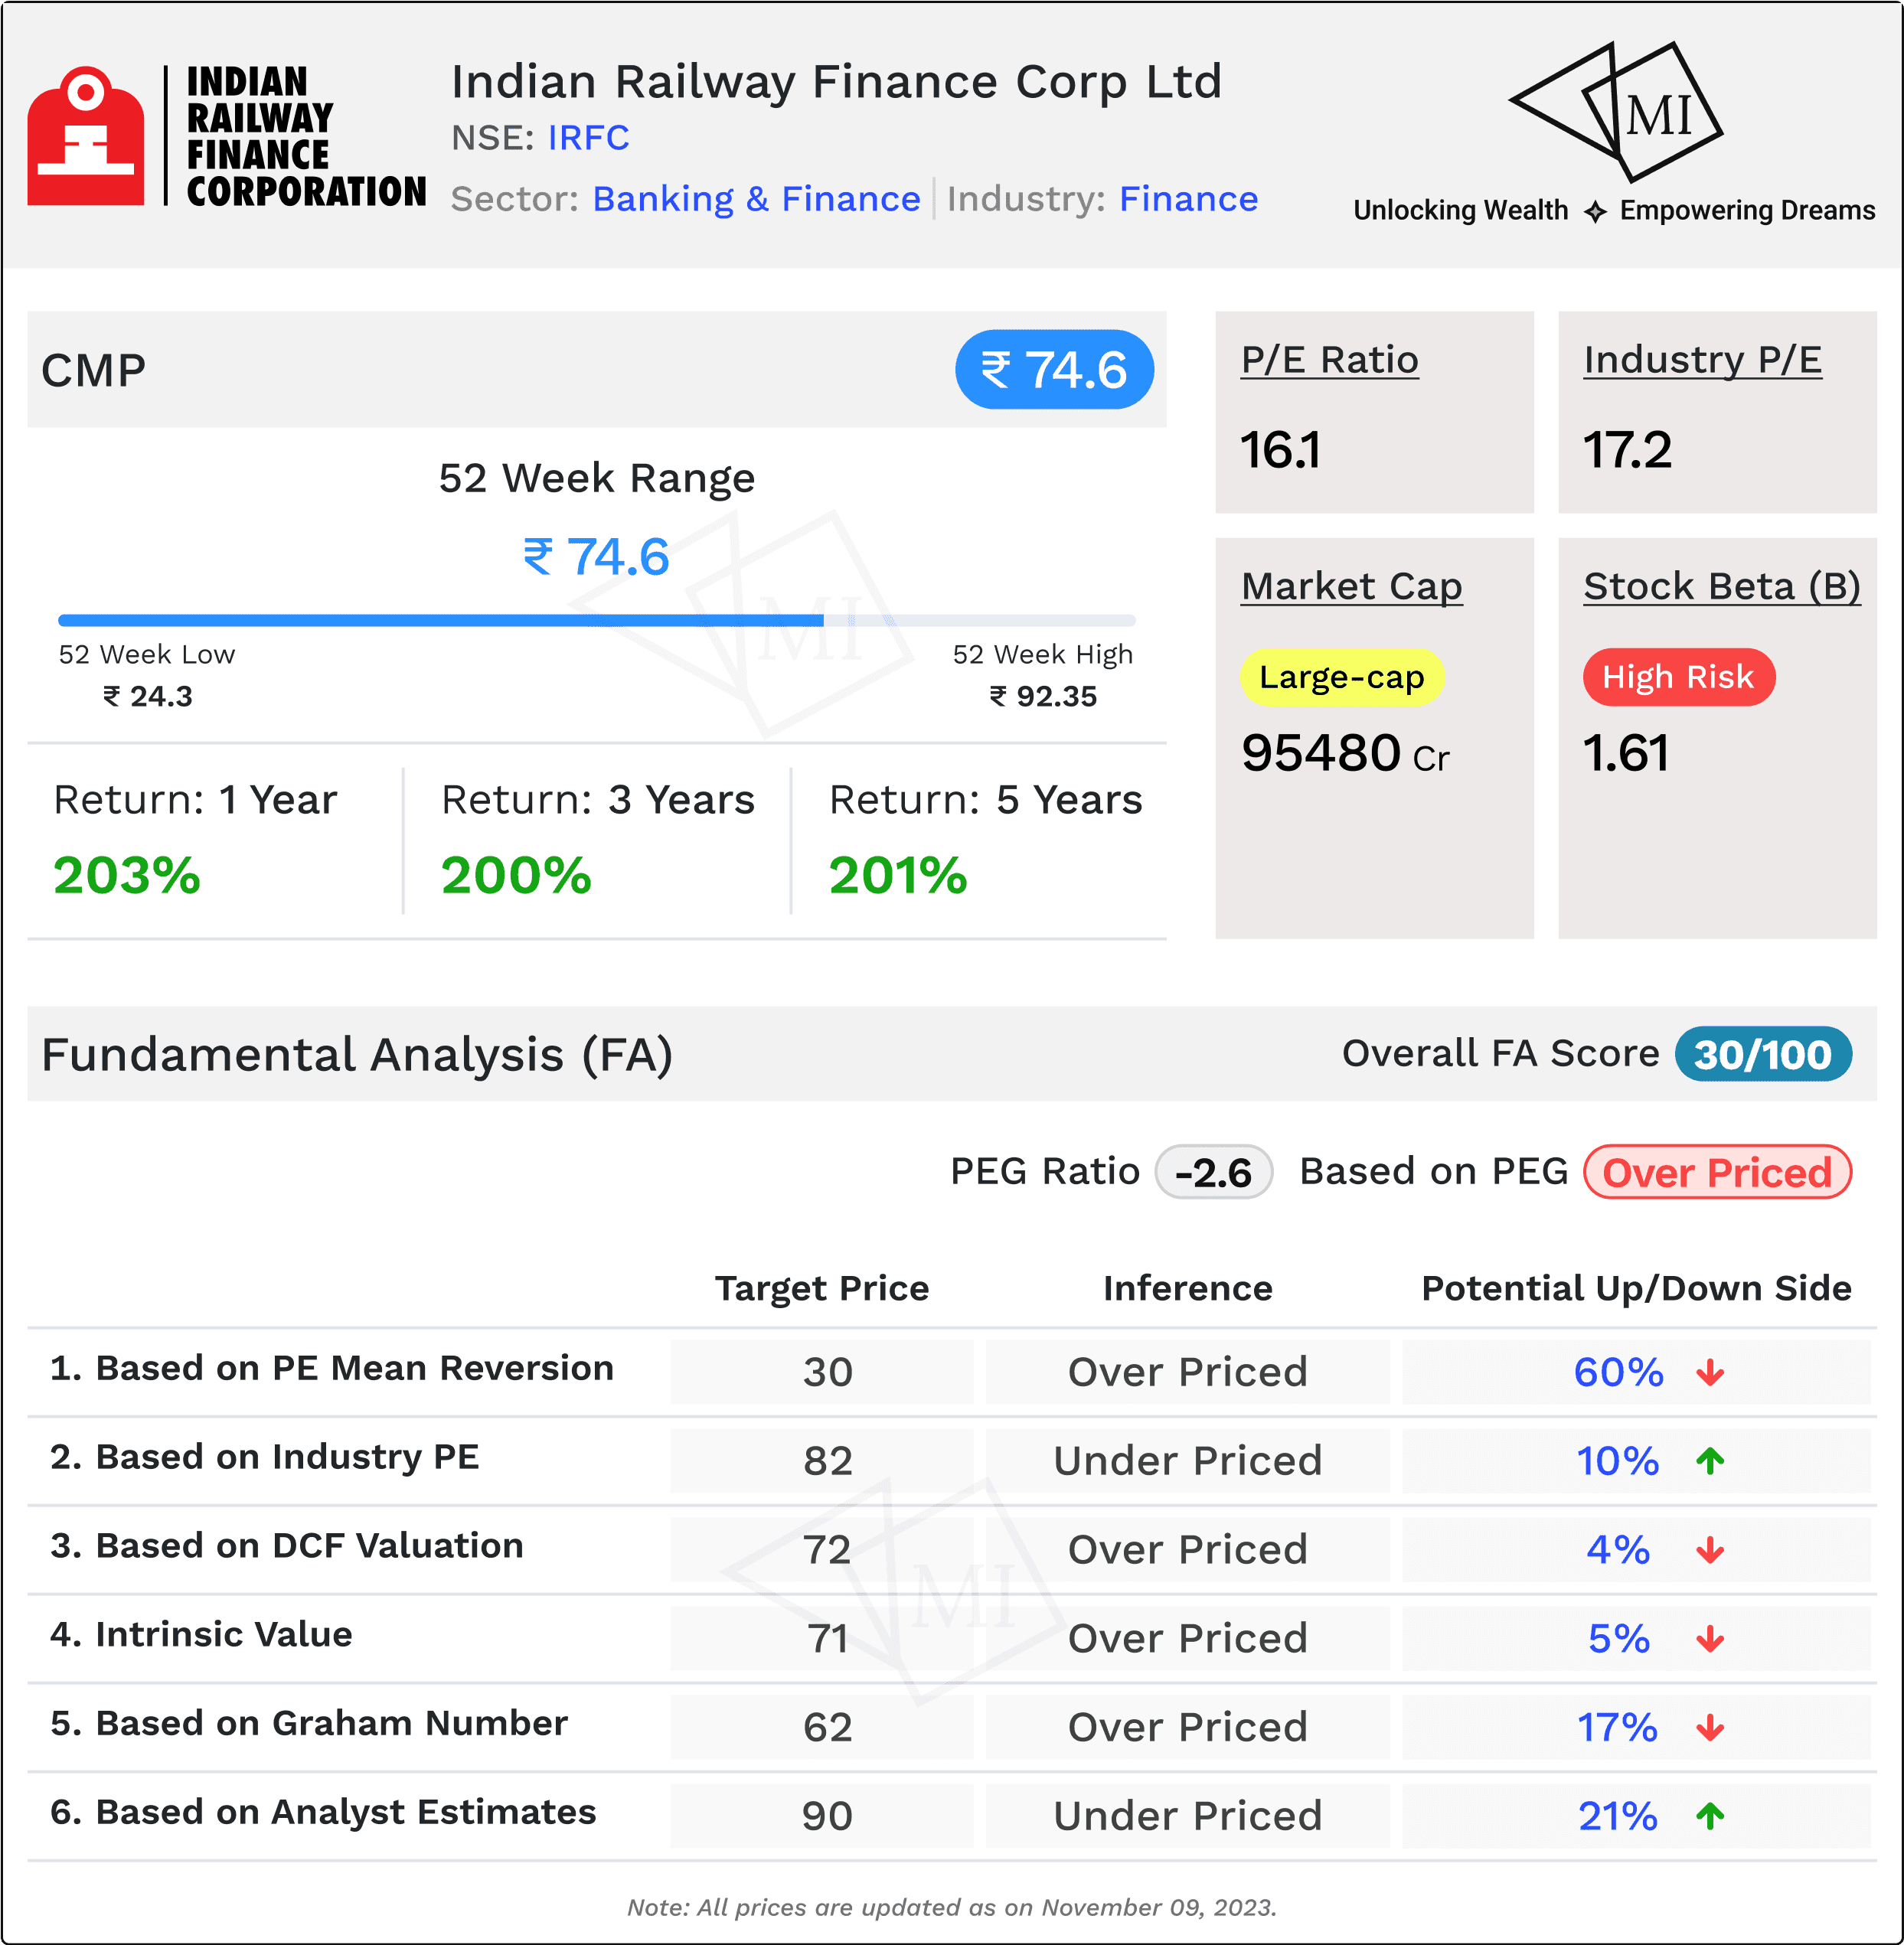
As of the latest update, IRFC's market price stands at INR 74.6, with a notable PEG ratio of -2.6. The negative PEG ratio implies that the stock might be overpriced concerning its earnings growth. This raises eyebrows among savvy investors who are quick to question the sustainability of the current valuation.
Expected Share Price Scenarios:
1. PE Mean Reversion:
Calculations based on PE mean reversion hint at an expected share price for IRFC at INR 30, suggesting a potential downside of a staggering 60%. This signals caution, implying that the stock might be significantly overvalued and vulnerable to a correction.
2. Industry PE Comparison:
Contrarily, when comparing IRFC's valuation to the industry PE, the expected share price for IRFC comes in at INR 82, indicating a potential upside of 10%. This seemingly conflicting perspective suggests that IRFC might be undervalued relative to its industry peers.
Valuation Models:
3. DCF Valuation (Base Case Scenario):
A DCF (Discounted Cash Flow) valuation in a base-case scenario for IRFC assigns a fair value of INR 72, with a potential downside of 4%. While this suggests a modest downside risk, it also underscores the need for a discerning eye when assessing the stock's current market price.
4. Intrinsic Value (Base Case Scenario):
The intrinsic value for IRFC is estimated at INR 71, hinting at a potential downside of 5%. This aligns with the DCF valuation, emphasizing the importance of evaluating multiple metrics for a comprehensive understanding.
Analyst Estimates and Graham Number:
5. Analyst Estimates:
Analysts foresee a brighter horizon, setting a target price for IRFC at INR 90. This optimistic projection implies a potential upside of 21%, providing a glimmer of hope for investors who believe in the long-term potential of IRFC.
6. Graham Number:
On the other hand, the Graham Number, a conservative valuation method, places the fair value for IRFC at INR 62, suggesting a potential downside of 17%. This cautionary estimate adds another layer to the intricate puzzle of IRFC's valuation.
Conclusion:
In the labyrinth of IRFC's share price, the fundamental analysis offers divergent perspectives. While some indicators raise red flags, others paint a picture of potential growth. Investors must tread cautiously, considering the multiple facets presented by these fundamental metrics.
Risk and Solvency Analysis (RSA) of IRFC
Investing in the stock market is akin to setting sail on a sea of uncertainties, where every decision carries a certain level of risk. In this section, we dissect the Risk and Solvency factors surrounding Indian Railway Finance Corporation (IRFC), shedding light on both the challenges and strengths that investors should consider when charting their course.
1. Stock Beta: Riding the High Waves
The Stock Beta of IRFC stands at 1.61, signifying a high-risk profile. This metric indicates that IRFC's stock tends to be more volatile than the market average. While higher beta stocks can potentially yield higher returns, they also come with increased susceptibility to market fluctuations. Investors eyeing IRFC should be prepared for a ride on the high waves of market dynamics.
2. Credit Rating: A Pillar of Stability
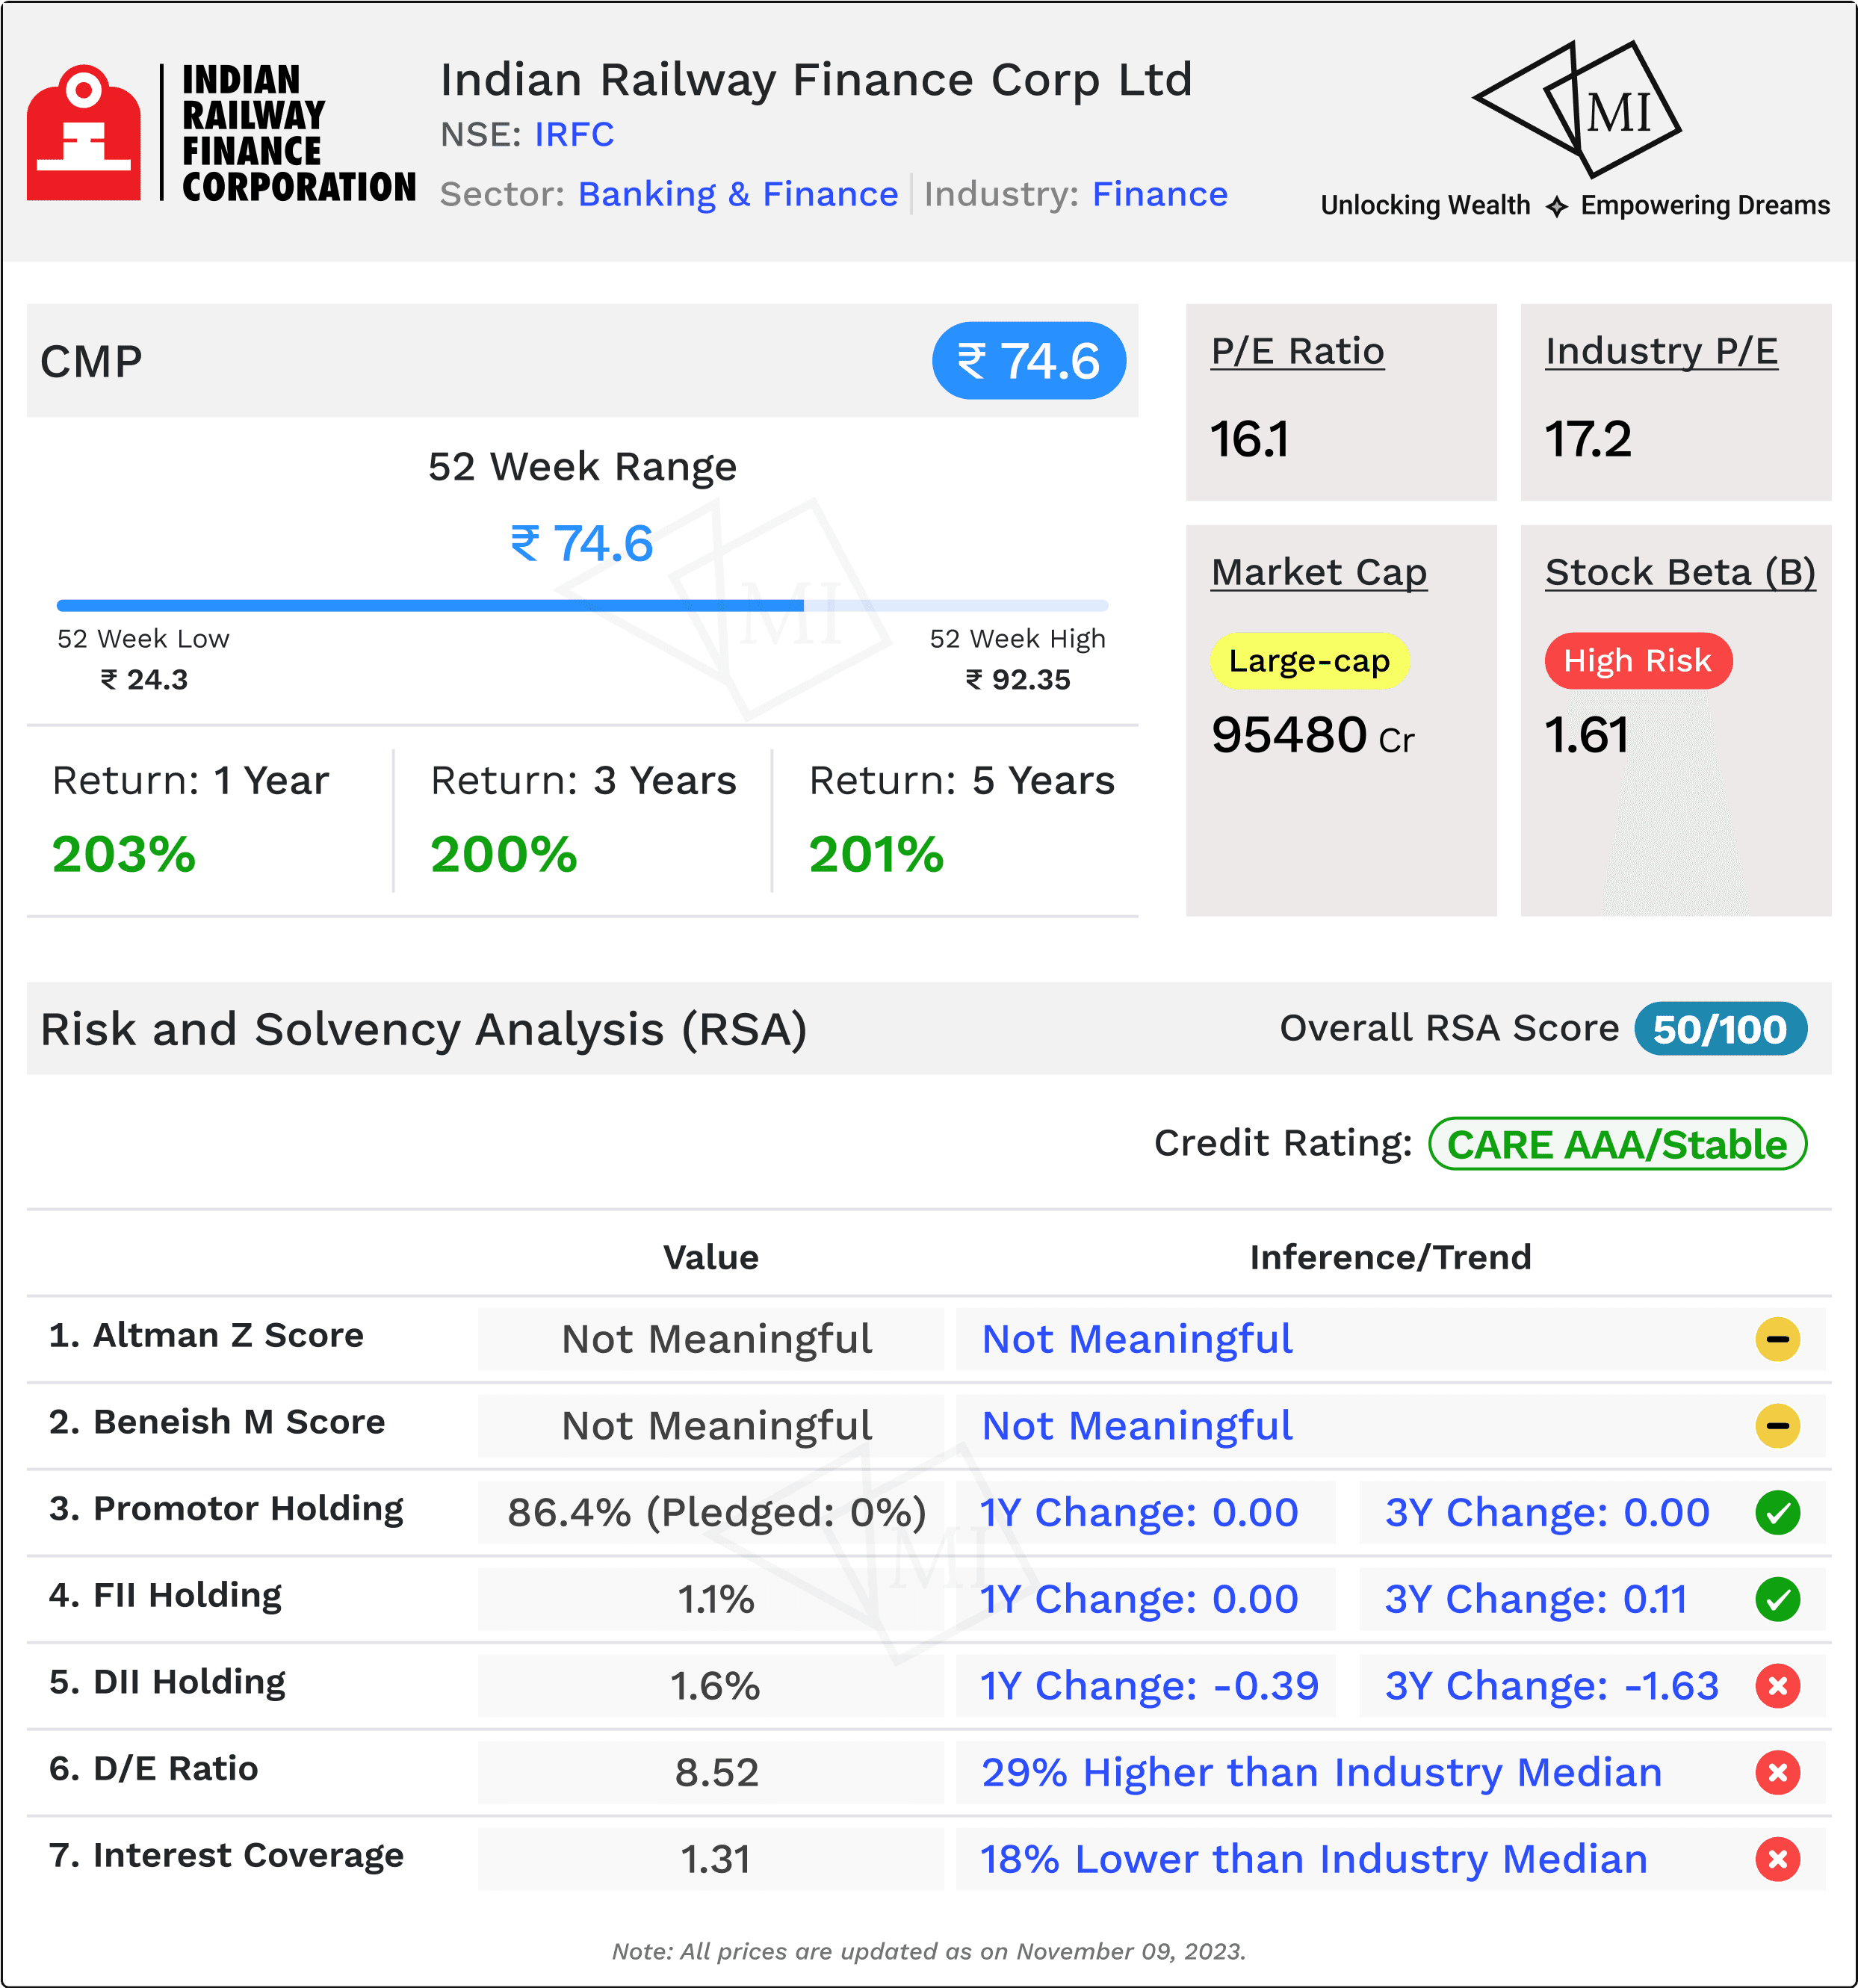
In contrast to the high stock beta, IRFC maintains a robust long-term credit rating of CARE AAA with a stable outlook. This rating, indicative of high creditworthiness, suggests a strong foundation of solvency. Despite the inherent volatility in the stock, the credit rating provides a reassuring anchor, assuring investors of the company's ability to meet its financial obligations over the long term.
3. Altman Z Score and Beneish M Score: The Unreadable Signals
The Altman Z Score and Beneish M Score for IRFC are deemed not meaningful, leaving investors without the traditional quantitative tools to assess bankruptcy risk and potential earnings manipulation. In such cases, it becomes imperative for investors to rely on other qualitative and quantitative indicators to gauge the company's financial health and integrity.
4. Ownership Structure: Promoters at the Helm
The stability of a company often lies in the hands of its promoters. IRFC boasts a strong promoter holding of 86.4%, with no pledged shares. The lack of change in promoter holding over the past year and three years signifies a steadfast commitment to the company's growth. This high level of promoter confidence can be a reassuring factor for investors, signaling a shared vision for the future.
5. Institutional Holding: FII and DII Participation
Foreign Institutional Investors (FII) and Domestic Institutional Investors (DII) play a pivotal role in market dynamics. While FII holding in IRFC stands at a modest 1.1%, with no significant changes over the past year or three years, DII holding, though slightly higher at 1.6%, has seen a reduction over the same period. Investors should closely monitor institutional sentiments, as their actions can influence market trends.
6. Leverage: D/E Ratio and Interest Coverage Ratio (ICR)
IRFC carries a Debt-to-Equity (D/E) ratio of 8.52, surpassing the industry median by 29%. This relatively high leverage suggests a higher reliance on debt for financing. The Interest Coverage Ratio (ICR) at 1.31 is 18% lower than the industry median, indicating a moderate ability to cover interest expenses. Investors must tread cautiously, considering the impact of high leverage on the company's financial stability.
Conclusion: Balancing on the Financial Tightrope
In the world of investments, risk and solvency are two sides of the same coin. IRFC's high beta and leverage pose challenges, but its strong credit rating, promoter confidence, and historical stability offer a counterbalance.
Summary and Conclusion: Recap and Final Thoughts on IRFC
As we draw the curtains on our exploration of the IRFC (Indian Railway Finance Corporation) share price target, let's weave together the threads of financial metrics and analysis that have guided us through the labyrinth of numbers and projections.
Financial Health Snapshot:
1. Financial Resilience Score (2.5/5):
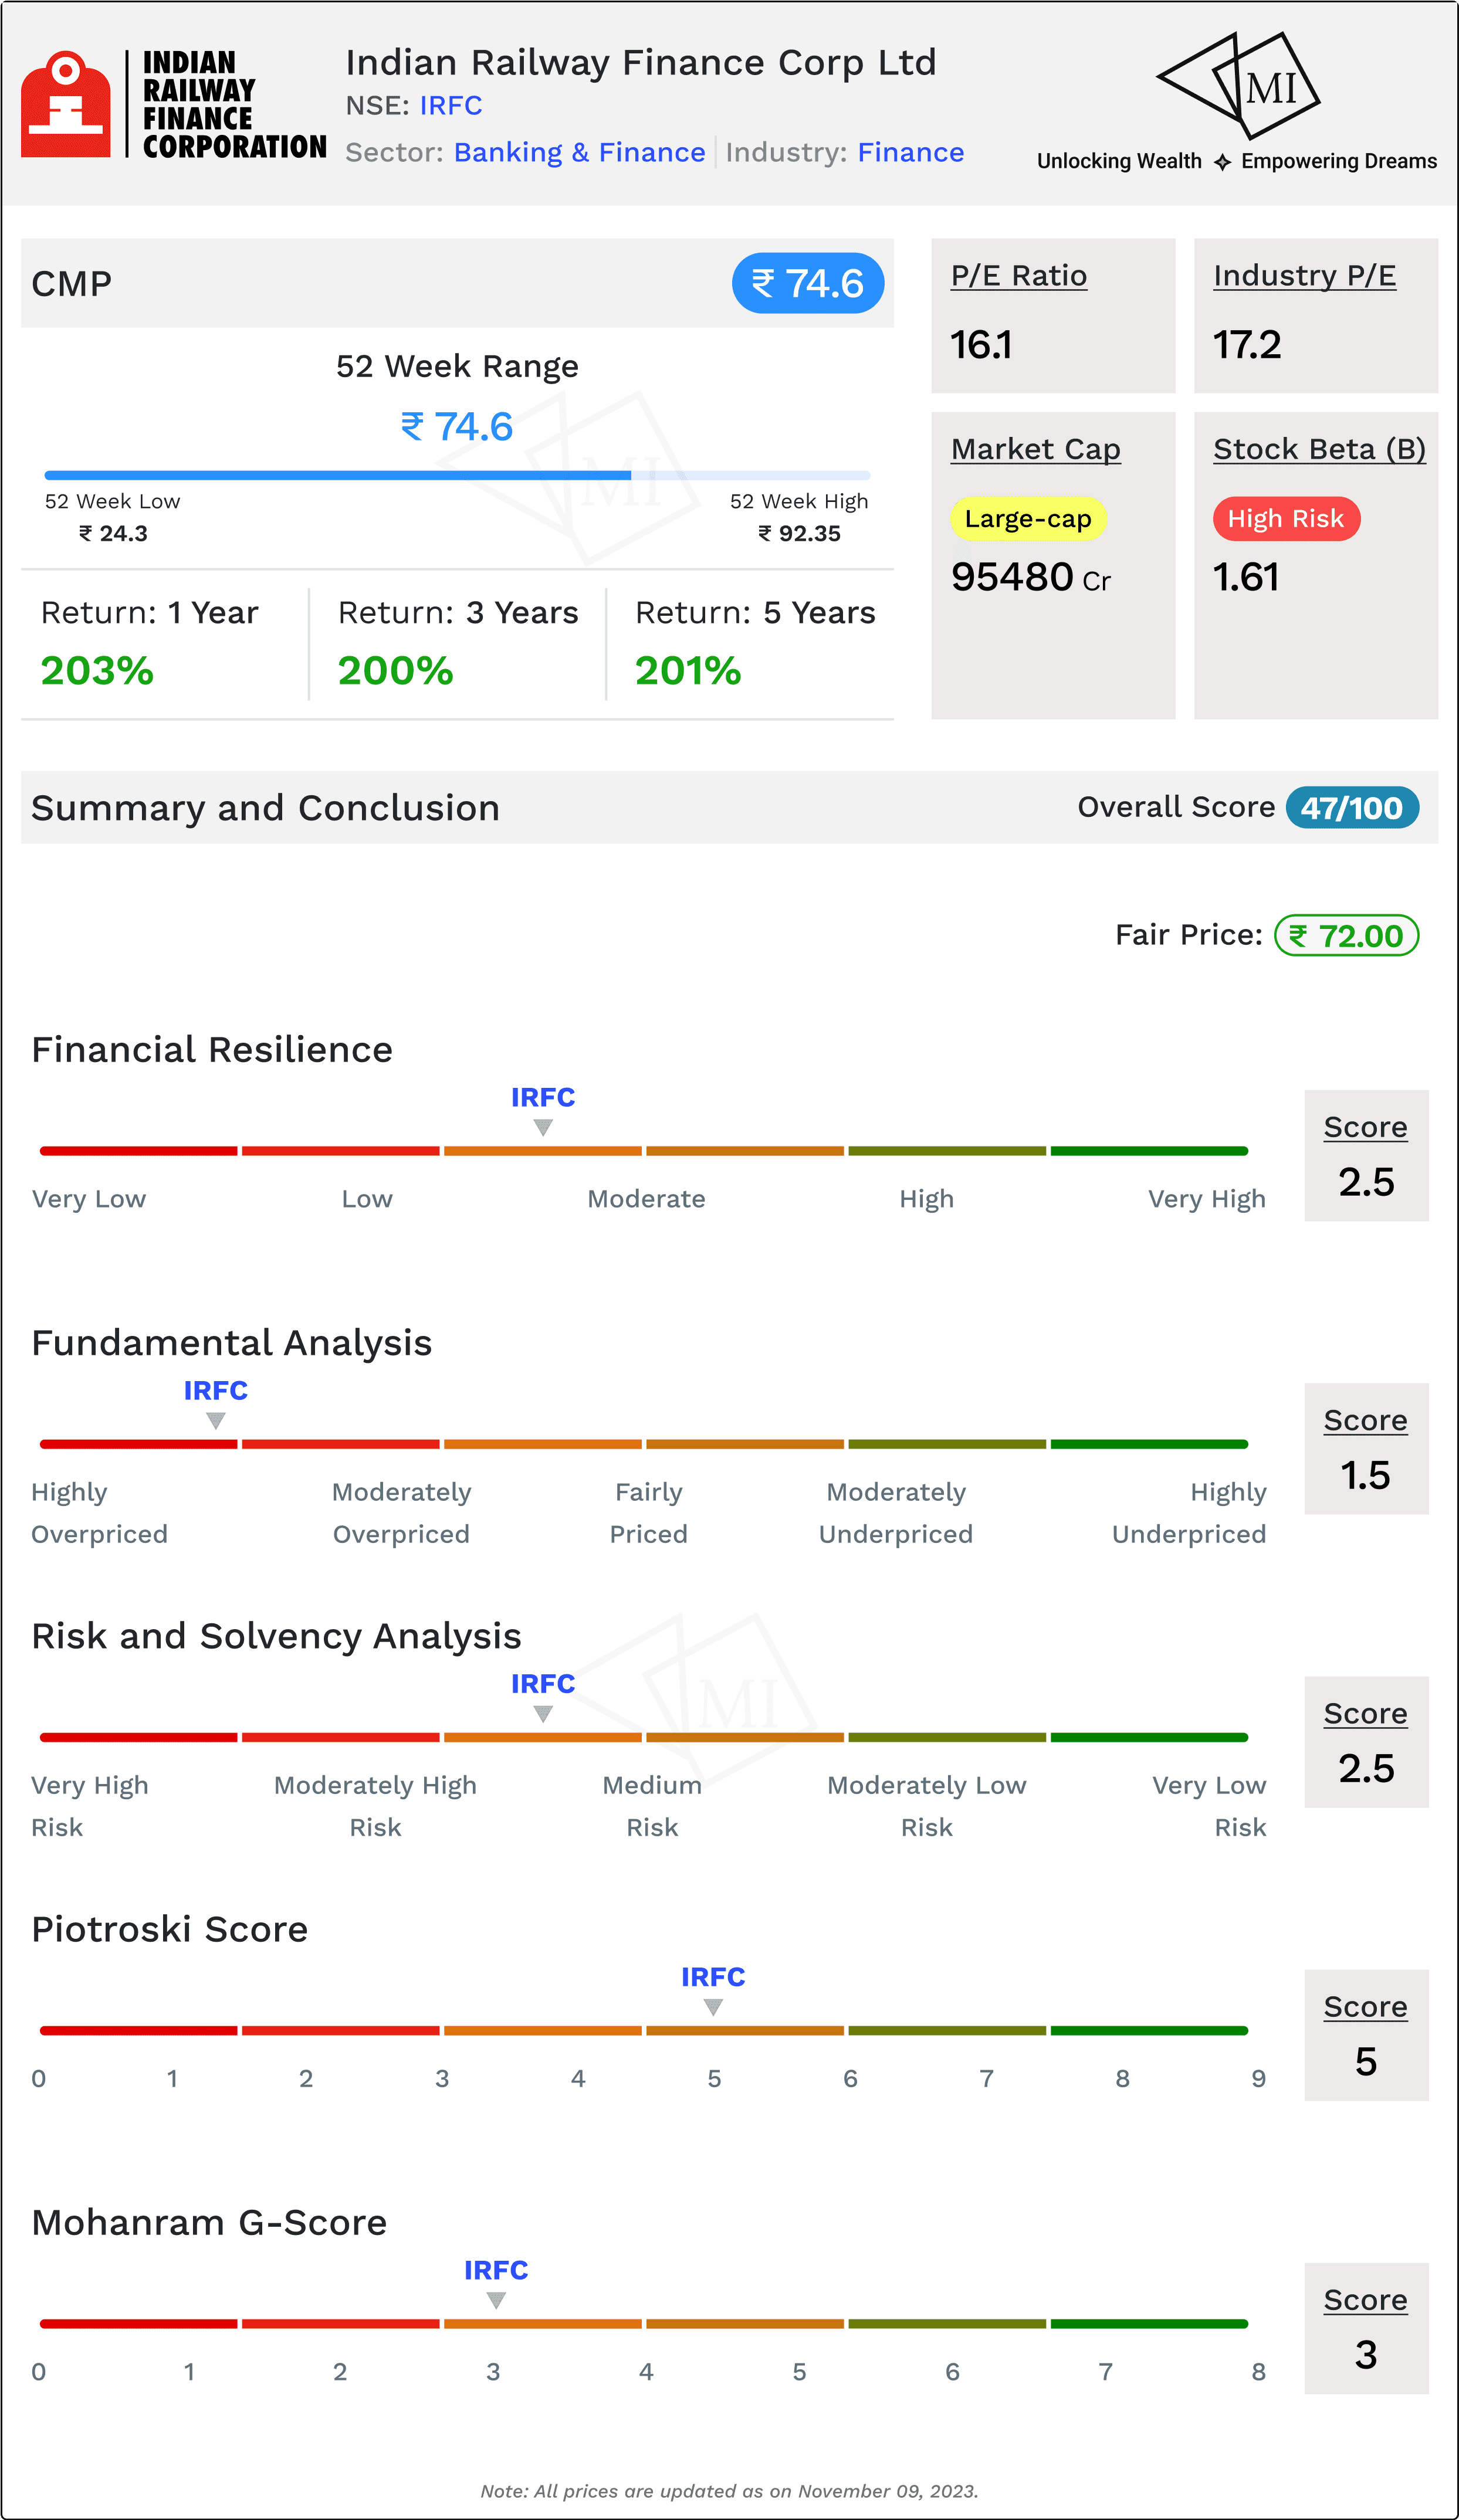
The Financial Resilience Score of 2.5 out of 5 sheds light on IRFC's ability to weather financial storms. While the score indicates a moderate level of resilience, it signals the importance of a cautious approach, particularly in a market where uncertainties can play a significant role.
2. Fundamental Analysis Score (1.5/5):
The Fundamental Analysis Score of 1.5 out of 5 raises concerns about the underlying strength of IRFC's financial foundation. This score serves as a cautionary flag, urging investors to carefully consider the fundamentals before making investment decisions.
3. Risk and Solvency Analysis Score (2.5/5):
A Risk and Solvency Analysis Score of 2.5 out of 5 reflects a moderate level of risk and solvency for IRFC. While it may not be alarming, it underscores the importance of monitoring risk factors closely, especially in a dynamic economic landscape.
Analytical Scores:
4. Piotroski Score (5 - Average):
The Piotroski Score of 5, signalling an average score, suggests that IRFC exhibits a mixed bag of financial strength and weaknesses. This score encourages a nuanced evaluation of various factors to gain a comprehensive understanding of the company's health.
5. Mohanram G-Score (3 - Low):
The Mohanram G-Score of 3, categorizing as low, adds a layer of caution. This score, which assesses the likelihood of financial distress, indicates that investors should approach IRFC with a discerning eye, acknowledging the potential risks involved.
Overall Assessment and Conclusion:
With an Overall Score of 47 out of 100 and a Fair Price for the Stock estimated at INR 72, a juxtaposition with the current market price of INR 74.6 reveals a marginally overpriced scenario. This suggests that, based on the comprehensive analysis, IRFC may have a limited upside potential in the short term.
In conclusion, while IRFC may offer certain strengths and opportunities, the cautionary flags raised by the scores emphasize the need for a prudent and well-informed approach. Investors should delve deeper into the specifics, keeping a watchful eye on the evolving market dynamics, industry trends, and the company's strategic moves. The IRFC share price is a puzzle, and successful investing lies in the ability to decipher its intricacies with diligence and a forward-looking perspective.
Information on Multibagger Investments is for educational purposes only and should not be considered financial advice. Users should conduct their own research and seek professional advice before making investment decisions.