2182% Return in 5 Years. Is it good time to buy Adani Green share?

Introduction
In the ever-evolving landscape of renewable energy, Adani Green Energy Limited emerges as a powerhouse, leading the charge towards a sustainable future. Established in 2015, the company operates as a holding entity overseeing diverse subsidiaries engaged in renewable power generation and ancillary activities.
Key Points that Define AGEL:
1. Adani Group Connection:
AGEL is a proud member of the Adani Group, a stalwart in India's industrial panorama. The Adani Group, with a colossal combined market capitalization of approximately USD 206 Billion as of April 2022, stands as a diversified conglomerate comprising seven publicly traded companies.
2. Revenue Dynamics:
In the fiscal year 2022, AGEL's revenue stream exhibited a strategic split. A robust 75% stemmed from power supply, underlining its commitment to renewable energy, while the remaining 25% was derived from traded goods, showcasing a diversified business model.
3. Formidable Project Portfolio:
AGEL's strength lies in its vast project portfolio. At the close of FY22, the company boasted 5,410 MW of operational projects and an additional 15,024 MW under construction, reaffirming its commitment to spearheading the renewable energy sector.
4. Robust Clientele:
A significant portion of AGEL's portfolio, constituting 89%, is fortified by executed Power Purchase Agreements (PPAs) with sovereign counterparts. Notable entities include the National Thermal Power Corporation (NTPC), Solar Energy Corporation of India (SECI), and various state DISCOMs.
5. Strategic Partnerships:
AGEL's collaboration with TOTAL SA, a leading French energy major, is a testament to its global vision. With TOTAL SA holding 20% equity in AGEL and 50% in 2.3 GW of operational solar assets, this partnership aims to accelerate the provision of affordable clean energy.
6. Acquisitions and Expansion:
The strategic acquisition of Vento Energy Infra and the completion of a 5 GW renewable energy portfolio from SB Energy underscore AGEL's commitment to expansion. With an added operational capacity of 1,940 MW in FY22, AGEL is steadfast in its pursuit of growth.
7. Financial Fortitude and Ambitious Goals:
AGEL, securing USD 1.6 billion in a revolving construction facility and raising USD 750 million through a bond issuance, is well-positioned for its ambitious plans. With a commitment to invest USD 20 billion in renewable energy development over the next decade, AGEL aims to achieve 25 GW operational capacity by 2025 and an impressive 45 GW by 2030.
In the unfolding chapters of India's renewable energy narrative, Adani Green Energy Limited not only contributes significantly but also stands as a beacon of innovation and sustainability, paving the way for a greener and brighter future.
Growth, Profitability, and Efficiency (GPE) of Adani Green
Adani Green Energy Limited has not just entered the renewable energy scene; it has emerged as a powerhouse, setting new standards in Growth, Profitability, and Efficiency (GPE). Let's delve into the numbers that make Adani Green a standout player in the market.
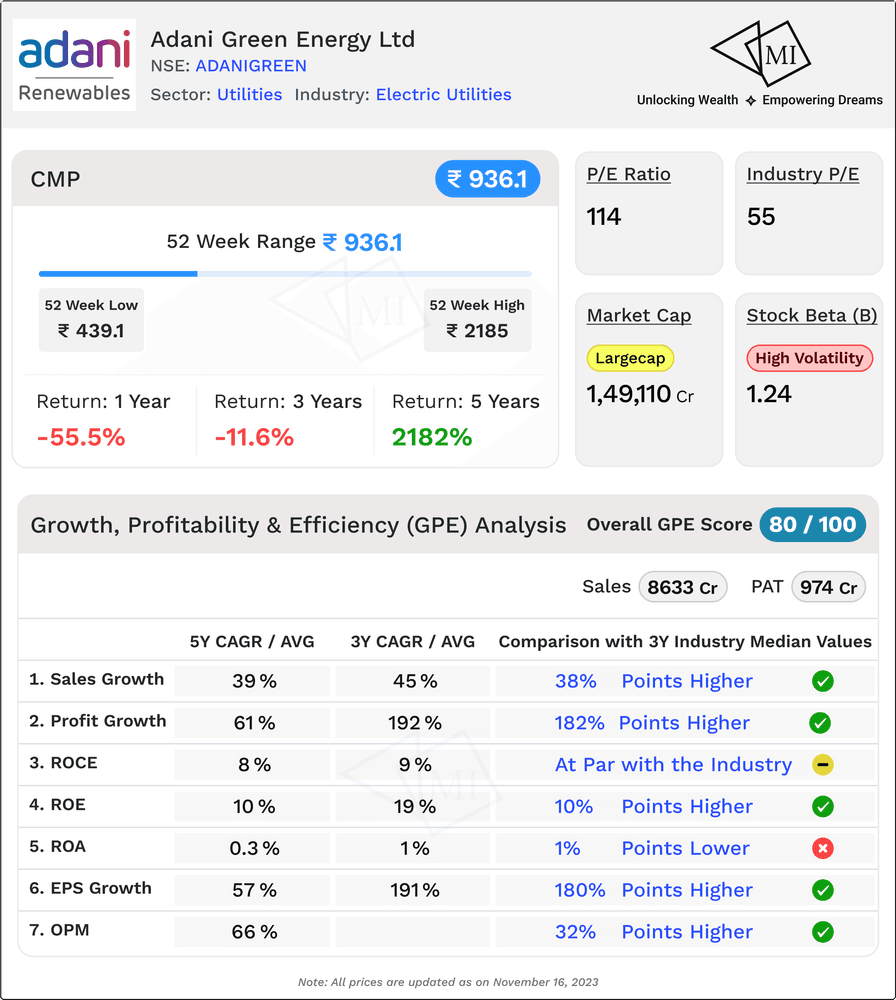
1. Sales Growth - Soaring Heights:
Adani Green's Sales Compound Annual Growth Rate (CAGR) over the last 3 years has been an impressive 45%, leaving competitors trailing behind by a substantial 38 percentage points. Even over a 5-year horizon, the company maintains a robust CAGR of 39%, outshining the median by an impressive 33 percentage points. This demonstrates not just growth but an acceleration that outpaces industry peers.
2. Profits Surge - Beyond Expectations:
The profitability metrics of Adani Green tell a story of unparalleled success. Over the past 3 years, the Profits CAGR has soared to an extraordinary 192%, a staggering 182 percentage points higher than the median of its peers. Looking at a 5-year horizon, the Profits CAGR stands strong at 61%, outperforming the median by a remarkable 47 percentage points. Adani Green's ability to convert revenue into profits is nothing short of exceptional.
3. Return on Capital Employed (ROCE) - On Par and Competing:
While Adani Green's ROCE over the past 3 years matches the median of its peers at 9%, a slight dip is observed in the 5-year average, standing at 8% which is 1 percentage point lower than the median of its peers. This suggests that while the company's recent capital employment is on par with industry standards, a longer-term perspective shows room for improvement, albeit by a slim margin.
4. Return on Equity (ROE) - Defying Gravity:
Adani Green excels in Return on Equity, with a 3-year average of 19%, surpassing the median by an outstanding 10 percentage points. Even over a 5-year period, the ROE average of 10% remains 3 percentage points higher than the median. This highlights the company's efficient utilization of shareholders' equity to generate profits, leaving competitors in its financial wake.
5. Return on Assets (ROA) - A Strategic Outlook:
Adani Green's Return on Assets over the past 3 years, at 1%, is slightly lower than the median of its peers. Similarly, the 5-year average of 0.3% is 2 percentage points below the median. While there is room for improvement in asset efficiency, the company's focus on other aspects of the business contributes significantly to overall performance.
6. Earnings per Share (EPS) Growth - Rewarding Shareholders:
Earnings per Share for Adani Green has experienced exceptional growth, with a 3-year growth rate of 191%, towering over the median by an astonishing 180 percentage points. Even over a 5-year period, the EPS growth of 57% outshines the median by 42 percentage points. This underscores the company's commitment to delivering value to its shareholders through consistently increasing earnings.
7. Operating Margin - Efficiency Redefined:
Adani Green's Operating Margin over the past 5 years, averaging at 66%, is an outstanding 32 percentage points higher than the median of its peers. This signals the company's unparalleled efficiency in managing costs and operations, contributing to sustained profitability that leaves competitors striving to catch up.
In conclusion, with a GPE Score of 80 on 100, Adani Green Energy Limited's GPE analysis showcases a company that not only exhibits exceptional growth but also excels in converting that growth into substantial profits. While some areas such as ROCE and ROA suggest room for enhancement, the overall trajectory of Adani Green is undeniably promising, making it an enticing prospect for investors seeking a blend of growth, profitability, and efficiency in the renewable energy sector.
Fundamental Analysis (FA) of Adani Green
Investors often find themselves at a crossroads when determining the fair value of a stock. Fundamental analysis comes to the forefront as a crucial tool, providing insights into a company's intrinsic worth. Let's dissect the fundamental analysis for Adani Green Energy Limited and explore various valuation metrics.
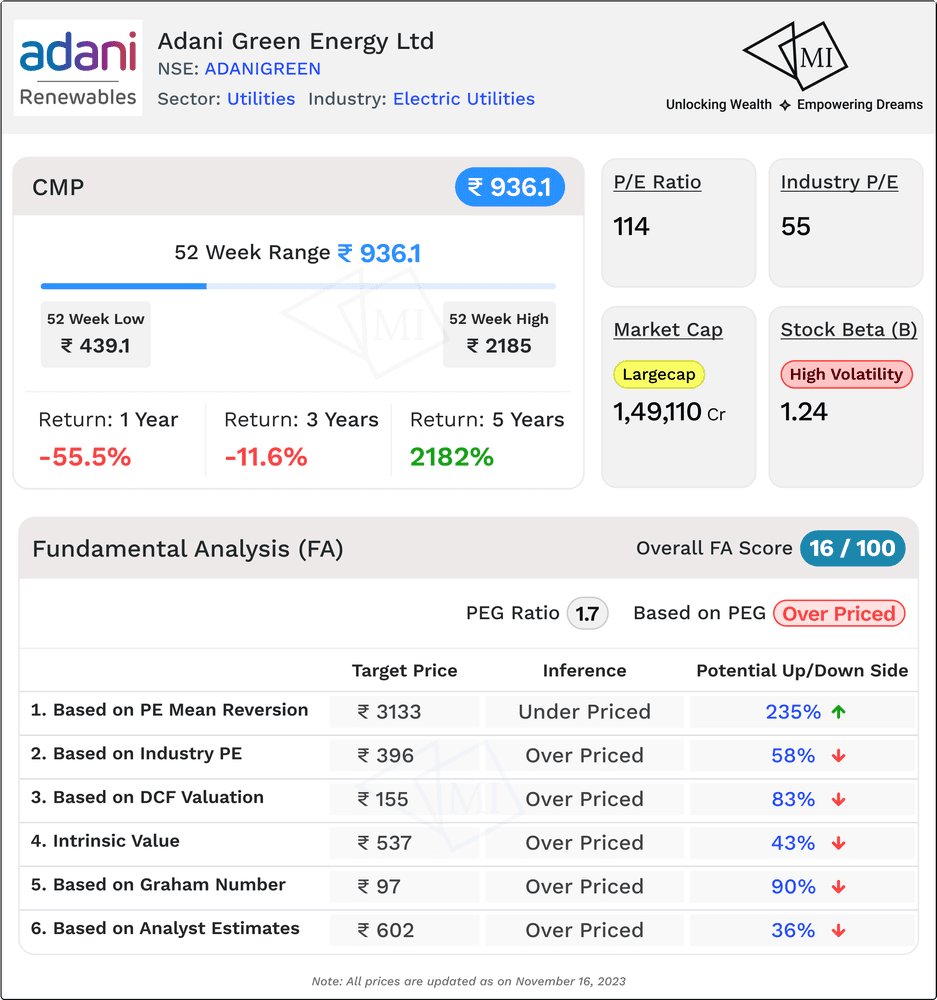
1. PEG Ratio: 1.7 (Inference - Stock is Overpriced)
The Price/Earnings to Growth (PEG) ratio stands at 1.7, suggesting the stock might be overpriced relative to its expected earnings growth. This indicates caution, prompting a deeper dive into alternative valuation methods.
2. Expected Share Price based on PE Mean Reversion: INR 3133 (Potential Upside of 235%)
In a scenario of PE mean reversion, the expected share price is projected to be INR 3133. This implies the stock is potentially underpriced, presenting a substantial upside of 235%. Investors may find this analysis encouraging.
3. Expected Share Price based on Industry PE: INR 396 (Potential Downside of 58%)
Comparing the stock's current price to the industry PE suggests a potential downside, with an expected share price of INR 396. This signals caution, hinting that the stock may be overvalued in comparison to industry peers.
4. Fair Value as per DCF Valuation (Base Case Scenario): INR 155 (Potential Downside of 83%)
In a discounted cash flow (DCF) valuation, the fair value for Adani Green is estimated at INR 155, indicating a significant downside of 83%. This suggests the current market price may be overinflated.
5. Intrinsic Value (Base Case Scenario): INR 537 (Potential Downside of 43%)
The intrinsic value of Adani Green, based on a fundamental assessment, is determined to be INR 537, pointing to a potential downside of 43%. This implies a level of overvaluation and a warning for investors.
6. Target Price as per Analyst Estimate: INR 602 (Potential Downside of 36%)
Analyst estimates peg the target price for Adani Green at INR 602, indicating a potential downside of 36%. While this suggests the stock may be slightly overvalued, the downside is less pronounced compared to other metrics.
7. Fair Value as per Graham Number: INR 97 (Potential Downside of 90%)
The Graham Number places the fair value at INR 97, signalling a substantial downside of 90%. This conservative estimate underscores a potential overvaluation in the current market price.
The Fundamental Analysis (FA) Score of 16 on 100 consolidates various valuation methods and financial metrics. A lower score indicates potential risks or overvaluation, urging investors to tread carefully.
In conclusion, the fundamental analysis for Adani Green Energy Limited presents a mixed picture. While few metrics, like PE mean reversion, hint at potential upside, majority others, such as DCF valuation and the Graham Number, suggest a notable downside.
Risk and Solvency Analysis (RSA) of Adani Green
Investing in the stock market is a delicate balance of risk and reward, and understanding the risk and solvency landscape is crucial for making informed decisions. Let's dive into the Risk and Solvency Analysis of Adani Green Energy Limited, examining various indicators that shed light on the company's financial health and stability.
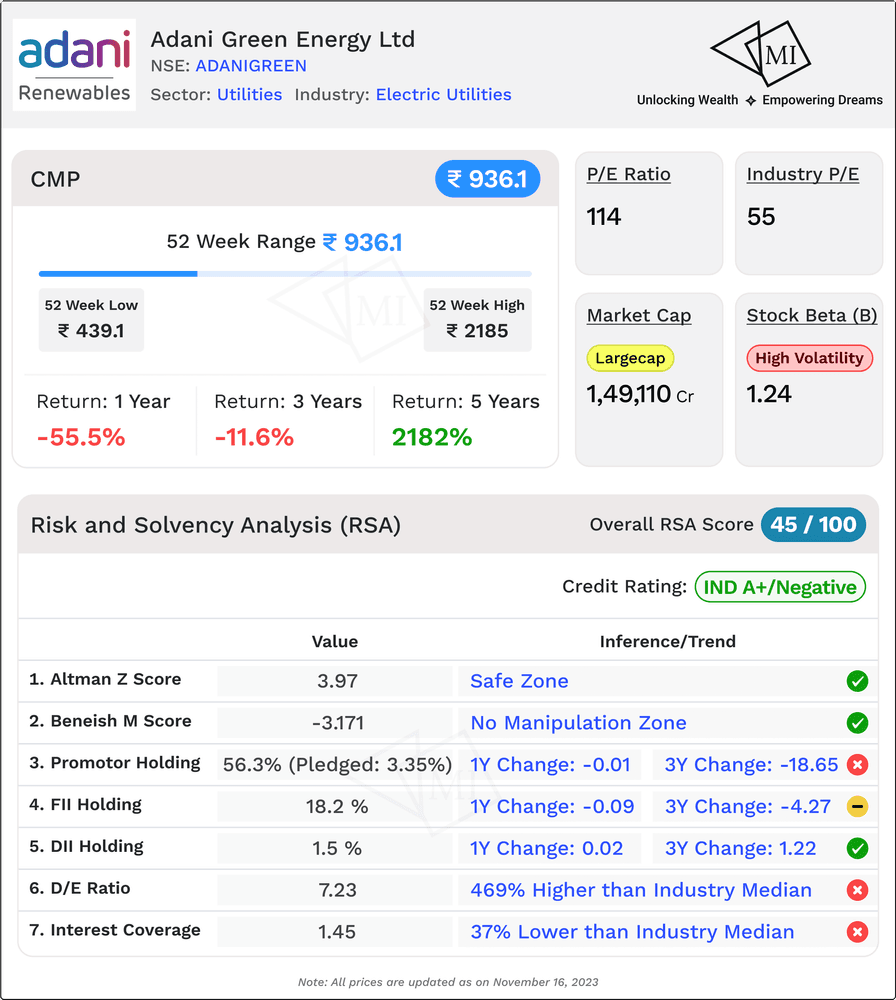
1. Stock Beta: 1.24 - Signifying High Risk:
The stock's beta of 1.24 suggests that Adani Green is more volatile than the market average. While higher beta stocks can offer greater returns, they also come with increased risk, making it important for investors to be vigilant in their approach.
2. Long Term Credit Rating - IND A+/Outlook Negative:
Adani Green's Long Term Credit Rating of IND A+ with a Negative Outlook signals a moderate level of credit risk. Investors should monitor any changes in the credit rating, as it reflects the company's ability to meet its long-term financial obligations.
3. Altman Z Score: 3.97 - Safe Zone:
The Altman Z Score of 3.97 places Adani Green in the safe zone. Developed by Edward Altman, this score assesses the likelihood of a company going bankrupt within two years. A score above 3 suggests financial stability, providing a reassuring outlook for investors.
4. Beneish M Score: -3.171 - No Manipulation Zone:
The Beneish M Score of -3.171 indicates that there are no signs of manipulation in Adani Green's financial statements. This score helps investors assess the likelihood of earnings manipulation, with negative values suggesting a lower probability.
5. Promoter, FII, and DII Holdings:
Promoter Holding (56.3%):
The substantial promoter holding indicates a vested interest in the company's success. However, it's essential to note the 3.35% pledged, which represents a potential risk if the promoters are forced to liquidate these shares.
FII Holding (18.2%):
Foreign Institutional Investors (FIIs) hold a significant stake, providing a global perspective on Adani Green's potential. The positive change in FII holding over the past year and three years reflects investor confidence.
DII Holding (1.5%):
Domestic Institutional Investors (DIIs) have a relatively small stake, with marginal changes over the past one and three years.
6. D/E Ratio: 7.23 - 469% Higher Than Industry Median:
The Debt-to-Equity (D/E) Ratio of 7.23 indicates that Adani Green has a significantly higher debt burden compared to the industry median. High debt levels can amplify risks, especially in challenging economic conditions.
7. ICR: 1.45 - 37% Lower Than Industry Median:
The Interest Coverage Ratio (ICR) of 1.45, lower than the industry median, suggests that Adani Green may face challenges in servicing its interest obligations. Investors should closely monitor any improvement or deterioration in this ratio.
In conclusion, with RSA Score on 45 on 100, Adani Green's Risk and Solvency Analysis provides a nuanced view of its financial standing. While the Altman Z Score and Beneish M Score instil confidence, the higher beta, negative credit outlook, pledged promoter holding, and elevated debt levels warrant careful consideration.
Summary and Conclusion: Recap and Final Thoughts on Adani Green
As we journey through the financial landscape of Adani Green Energy Limited, a comprehensive assessment unveils a story of resilience, challenges, and potential. Let's distill the key findings into a concise summary, drawing on various scores and indicators.
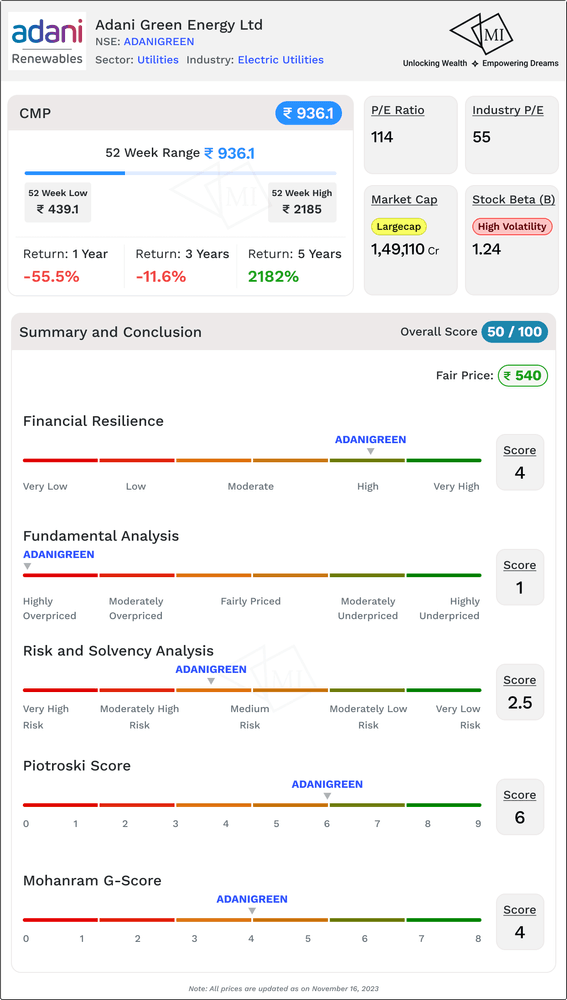
1. Financial Resilience: 4 on 5 - Strong Foundation:
Adani Green exhibits robust financial resilience with a score of 4 on 5. This score underscores the company's ability to weather economic uncertainties and maintain stability in its financial foundations.
2. Fundamental Analysis: 1 on 5 - Room for Improvement:
The Fundamental Analysis score of 1 on 5 signals a landscape that demands careful consideration. While certain metrics point towards potential upsides, others indicate a downside risk. Investors are advised to approach with caution and conduct a thorough analysis before making decisions.
3. Risk and Solvency Analysis: 2.5 on 5 - A Balancing Act:
The Risk and Solvency Analysis score of 2.5 on 5 reflects a nuanced scenario. While Adani Green operates in a zone of moderate risk, areas like the Debt-to-Equity ratio and Interest Coverage Ratio warrant close attention. Investors should weigh potential returns against associated risks.
4. Piotroski Score: 4 (Average) - Maintaining Steady Ground:
With a Piotroski Score of 4, Adani Green sits in the average range. This suggests a company that is holding its ground, but there's room for improvement in certain financial metrics.
5. Mohanram G-Score: 4 (Average) - A Balanced Outlook:
The Mohanram G-Score of 4 aligns with the average trend, indicating a balanced outlook. While it's not signalling alarming distress, it's crucial for investors to stay vigilant and monitor any changes in the company's financial health.
Overall Score: 50 on 100 - A Balanced Verdict:
The amalgamation of various scores culminates in an overall score of 50 on 100 for Adani Green. This suggests a balanced stance – not without challenges yet offering potential opportunities. Investors must carefully weigh the pros and cons, considering their risk tolerance and investment objectives.
Fair Price for Stock: INR 540 - A Price Tag for Consideration:
The calculated fair price for Adani Green's stock stands at INR 540, in contrast to the current market price of INR 936.1. This stark difference underscores a potential gap between the perceived value and the market valuation. Investors should carefully assess whether the current market price aligns with their valuation perspectives.
In conclusion, Adani Green Energy Limited presents itself as a player with a solid financial foundation, a mix of strengths, and areas for improvement. The overall score of 50 on 100 serves as a reminder of the delicate balance in the market. As with any investment, thorough due diligence, constant monitoring, and a strategic approach are paramount.
Information on Multibagger Investments is for educational purposes only and should not be considered financial advice. Users should conduct their own research and seek professional advice before making investment decisions.