Nearing 52 Week Low Mark. Is it Good Time to Buy Adani Wilmar Share?



Introduction
About:
Founded in 1999, Adani Wilmar Ltd is a dynamic player in the edible oil and FMCG domain. This joint venture between Adani and the Singapore-based Wilmar Group has evolved into a significant force in the agri-business sector. Beyond the culinary spectrum, the company delves into industry essentials like castor derivatives and Oleo derivatives.
Key Points:
Business Overview:
Adani Wilmar caters to the edible oil, food, and FMCG segments, carrying illustrious brands such as Fortune, King's, and Kohinoor. With subsidiaries in Bangladesh engaged in refining crude edible oil, the company's footprint extends globally.
Product Profile:
From kitchen essentials like edible oil and pulses to industrial must-haves such as Oleochemicals, Adani Wilmar covers a diverse spectrum. Its manufacturing prowess spans 22 plants across 10 states, reflecting a robust commitment to quality and quantity.
Distribution Network:
Boasting 5,590 distributors across India and 88 strategically placed depots, the company's distribution network is a testament to its wide-reaching impact, serving over 16 lakh retail outlets.
Market Share:
Adani Wilmar commands significant market shares, with approximately 20% in Edible Oil, 5% in Wheat, and 8% in Rice, solidifying its position as a key player in essential food products.
Segment and Geographical Revenue Breakup:
In FY22, Edible Oil constituted a substantial 79% of the revenue, with Food & FMCG contributing 7%, and Industry Essentials making up 14%. Domestically, the company's sales dominate, accounting for 92%, while exports contribute the remaining 8%.
As we delve deeper into Adani Wilmar's multifaceted presence in the market, it's evident that this company is not just a culinary cornerstone but a pivotal force in shaping the agri-business landscape.
Growth, Profitability, and Efficiency (GPE) Analysis of Adani Wilmar
In the ever-evolving landscape of the edible oil and agri-processing industry, Adani Wilmar Limited stands as a prominent player. To gain insight into its trajectory, let's delve into a comprehensive Growth, Profitability, and Efficiency (GPE) analysis.
1. Sales Growth - A Towering Momentum:
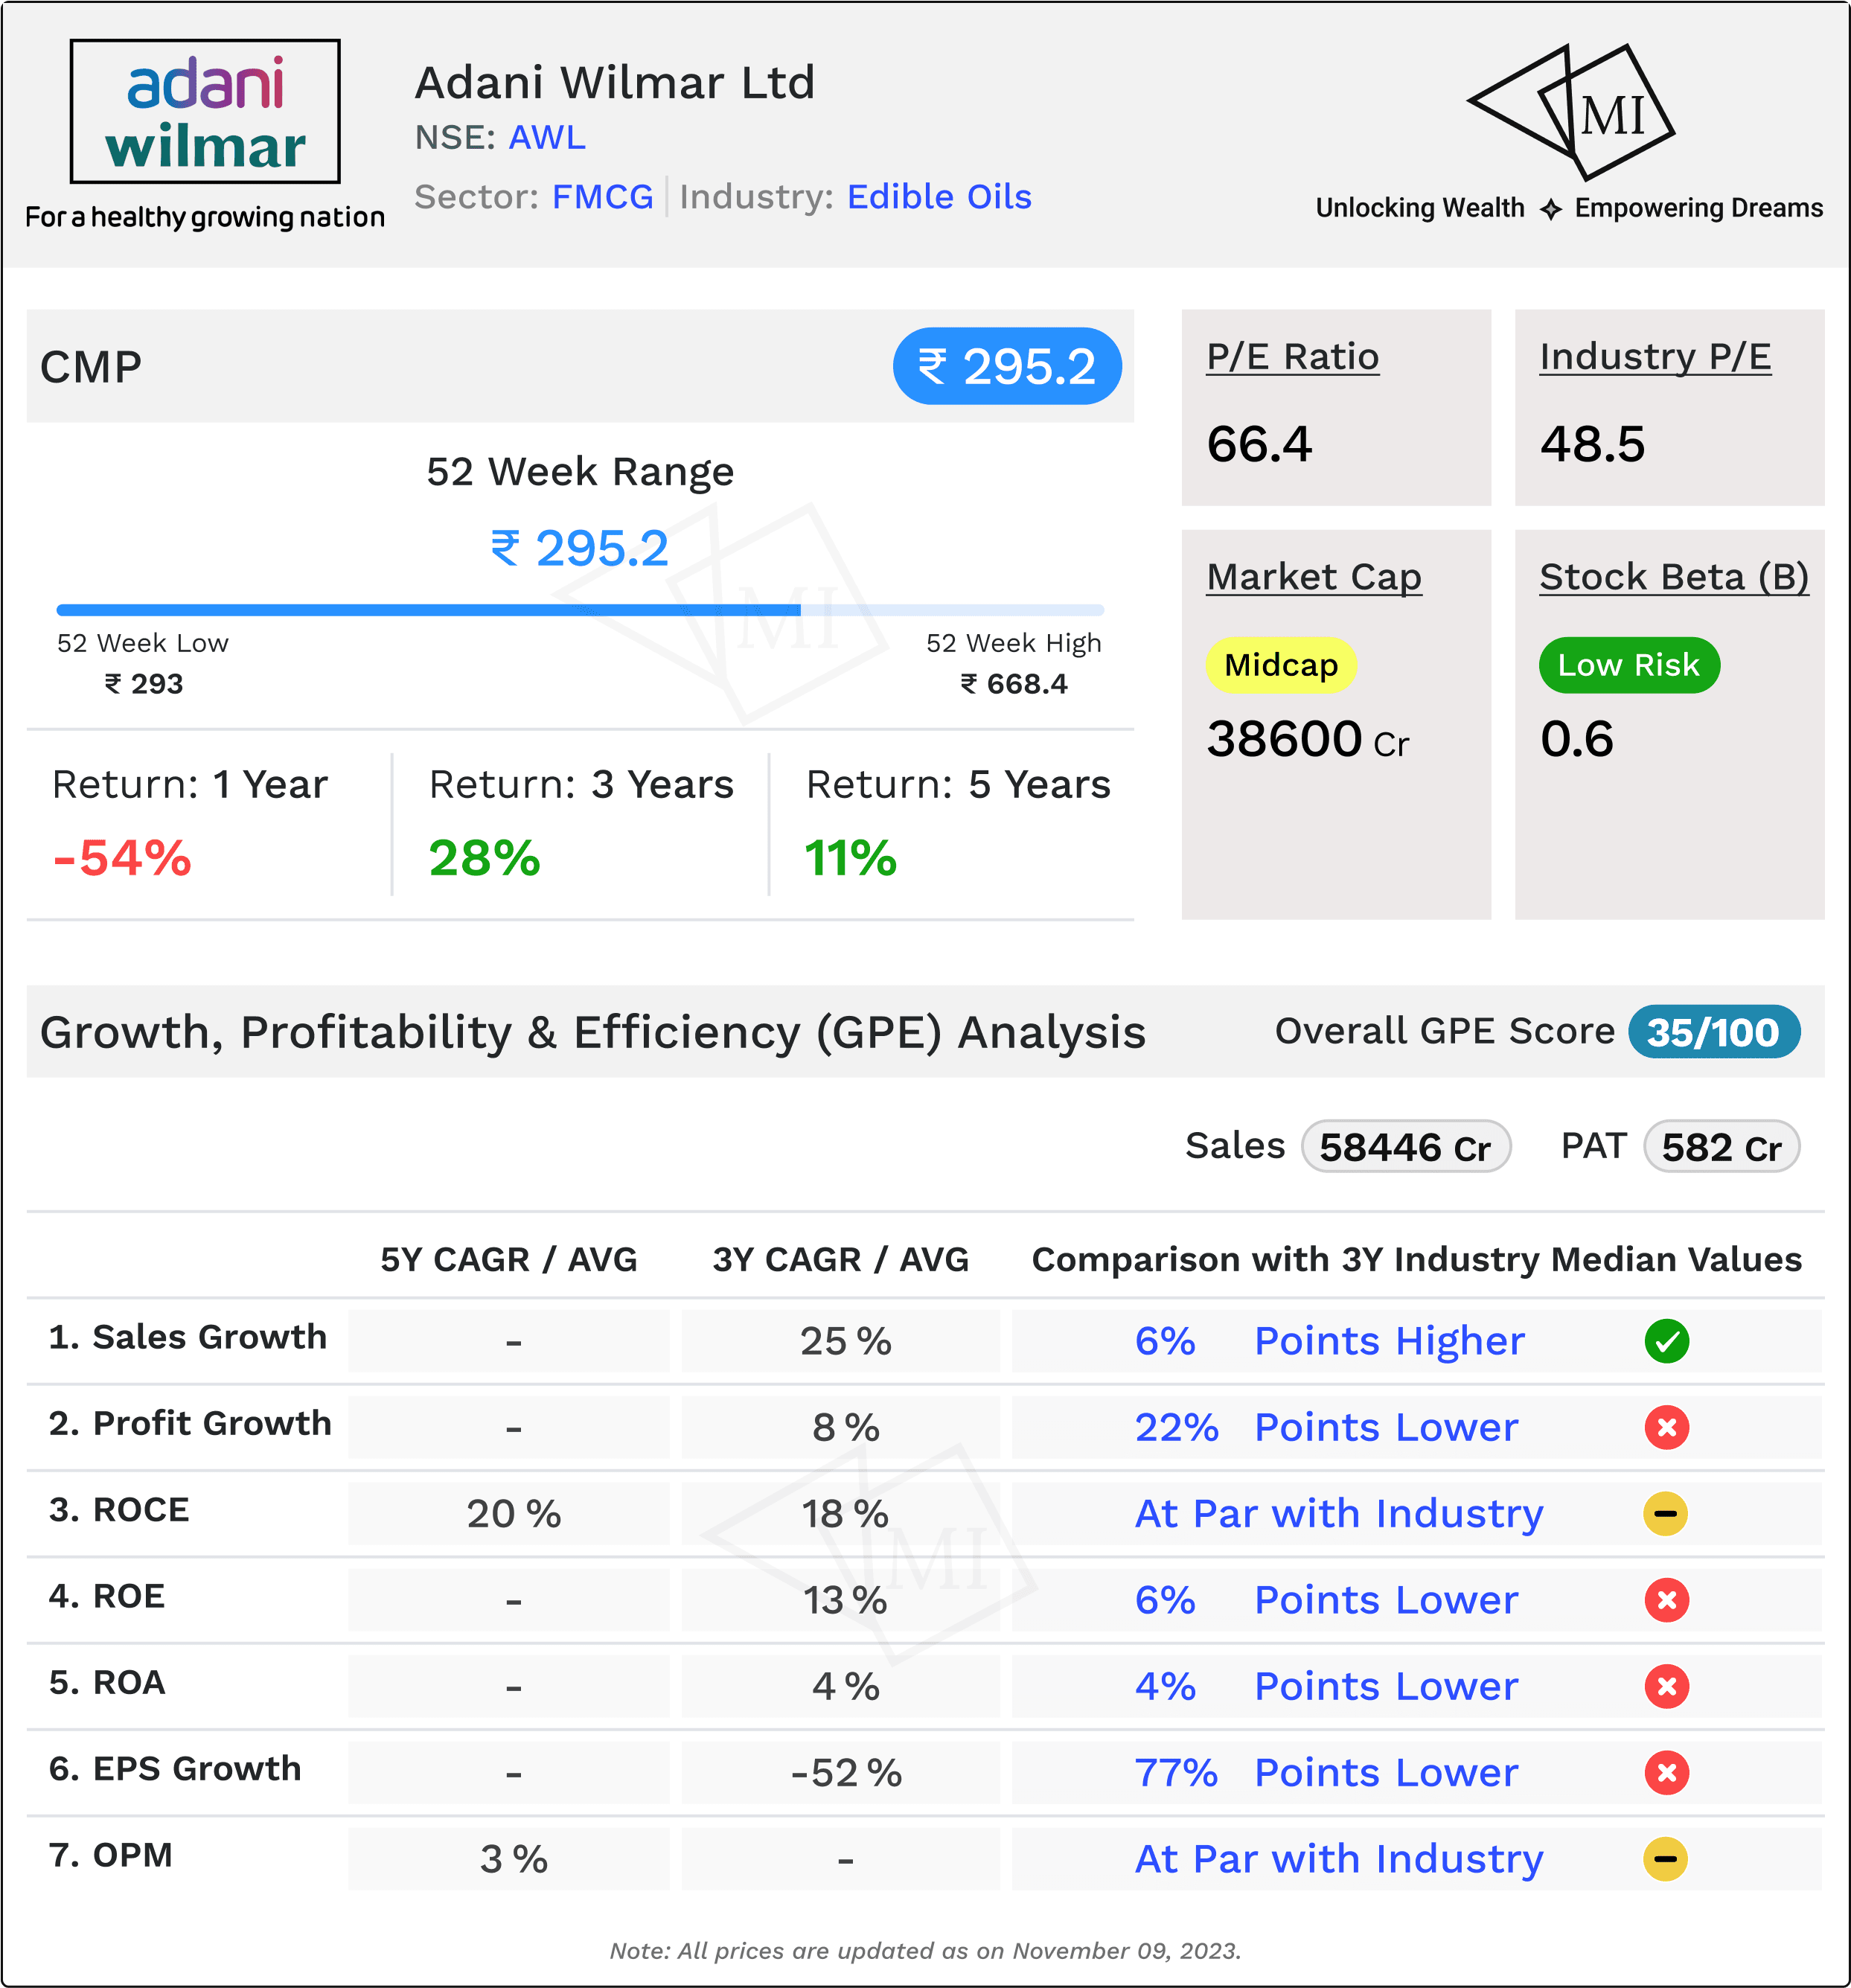
Adani Wilmar has showcased an impressive Sales 3Y CAGR of 25%, outpacing peers by a notable 6%. This robust growth signals a healthy market presence and an effective market strategy, positioning the company as a dynamic force.
2. Profits - A Balancing Act:
While sales paint a picture of vitality, the Profits 3Y CAGR at 8% reveals a nuanced narrative. Despite a steady growth trajectory, Adani Wilmar trails behind peers by 22%. This calls for a closer examination of the company's cost structures and profit generation mechanisms.
3. Return on Capital Employed (ROCE) - Sustaining Par Excellence:
Adani Wilmar maintains a commendable ROCE 3Y Avg of 18%, aligning with the median of peers. Looking at a broader horizon, the ROCE 5Y Avg at 20% positions the company 4% higher than the peer median. This suggests efficient utilization of capital over the years, underlining the company's operational prowess.
4. Return on Equity (ROE) - A Quest for Enhancement:
The ROE 3Y Avg at 13% reflects a marginal lag behind peers by 6%. To fortify its financial standing, Adani Wilmar might explore avenues to enhance shareholder value and boost profitability in the long run.
5. Return on Assets (ROA) - Fine-Tuning Efficiency:
Adani Wilmar's ROA 3Y Avg at 4% indicates a 4% shortfall compared to peers. While the company demonstrates effectiveness in asset utilization, further refinements could amplify operational efficiency.
6. Earnings Per Share (EPS) Growth - A Pitfall in the Path:
A stark contrast emerges in the EPS 3Y Growth, plummeting by -52%, a staggering 77% lower than peer performance. This demands a meticulous examination of factors affecting earnings and a strategic reassessment for future growth.
7. Operating Margin - Balancing Act in Progress:
Adani Wilmar navigates a delicate balance with an Operating Margin 5Y Avg at 3%, mirroring the median of peers. Fine-tuning operational efficiency may hold the key to elevating these margins in the competitive landscape.
In conclusion, Adani Wilmar's GPE analysis unravels a narrative of robust sales growth, steady profitability, and a commitment to operational efficiency. However, challenges in profitability metrics and EPS growth signal areas for strategic refinement.
Fundamental Analysis (FA) of Adani Wilmar
In the dynamic realm of the stock market, understanding the fundamentals of a company is paramount for informed decision-making. Let's delve into the fundamental analysis of Adani Wilmar Limited, deciphering the intricacies that shape its market valuation.
1. Current Market Price:
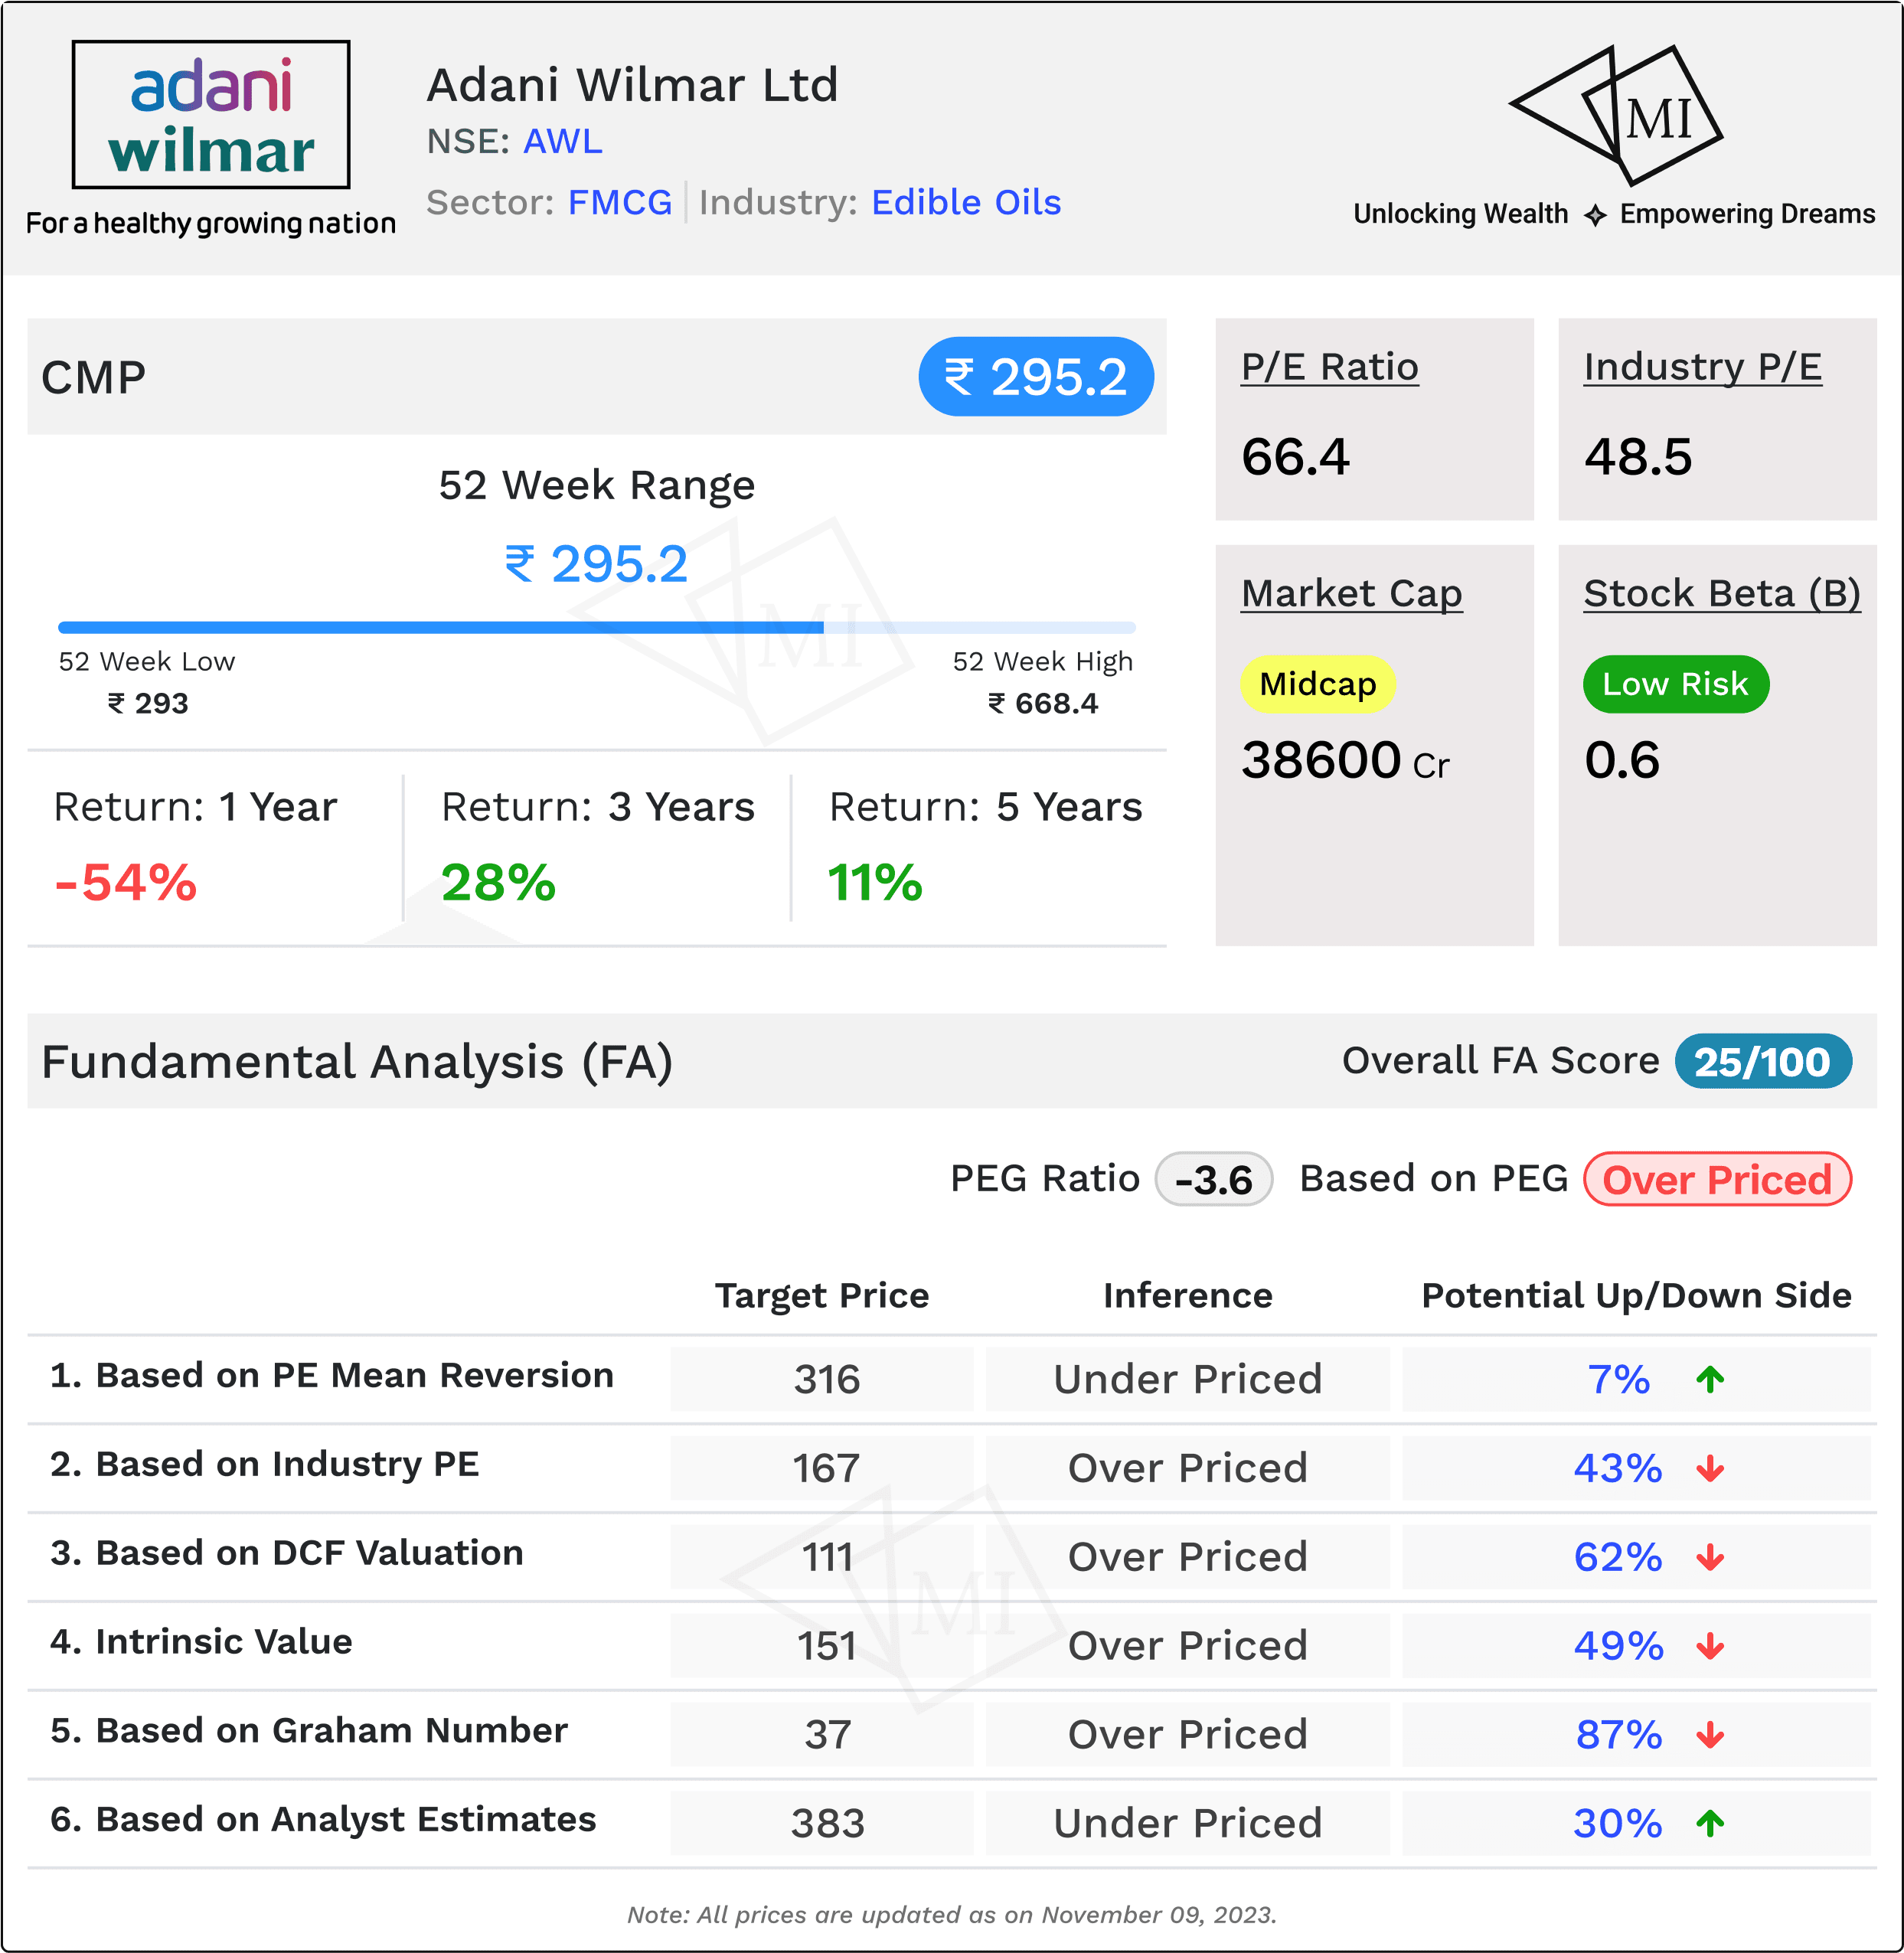
At the crossroads of investment decisions, Adani Wilmar's current market price stands at INR 295.2. This serves as our starting point, a baseline against which we'll gauge its intrinsic worth.
2. PEG Ratio - A Glimpse into Growth Potential:
The PEG Ratio at -3.6 unveils an intriguing narrative. A negative PEG suggests the stock might be overpriced, hinting at a potential imbalance between its market value and growth prospects.
3. Expected Share Price based on PE Mean Reversion:
Considering PE mean reversion, the expected share price for Adani Wilmar is estimated at INR 316. This implies an underpriced scenario, presenting an upside of 7% from the current market price.
4. Expected Share Price based on Industry PE:
Assessing against the industry PE, the expected share price for Adani Wilmar dwindles to INR 167, signalling a potential downside of 43%. This prompts a cautious evaluation, underlining the need to scrutinize industry dynamics and company-specific factors.
5. Fair Value as per DCF Valuation:
Delving into discounted cash flow (DCF) valuation, the base-case fair value for Adani Wilmar is projected at INR 111. This assessment paints a picture of overvaluation, indicating a potential downside of 62%.
6. Intrinsic Value:
Exploring intrinsic value under the base-case scenario for Adani Wilmar yields INR 151. While the stock remains overpriced, the potential downside of 49% prompts a closer examination of the factors influencing its intrinsic worth.
7. Target Price as per Analyst Estimate:
Analyst estimates peg the target price for Adani Wilmar at INR 383, portraying an underpriced scenario. This optimistic outlook suggests a substantial upside of 30%, aligning with the potential for growth in Adani Wilmar's market standing.
8. Fair Value as per Graham Number:
Contrastingly, the fair value as per Graham Number plunges to INR 37, indicating a significant overpricing with a potential downside of 87%. This prompts a critical assessment of valuation methodologies and associated risks.
In conclusion, Adani Wilmar's fundamental analysis reveals a nuanced landscape. While certain metrics hint at potential overpricing, others present an optimistic outlook.
Risk and Solvency Analysis (RSA) of Adani Wilmar
In the unpredictable seas of the stock market, understanding a company's risk and solvency profile becomes imperative for investors. Let's embark on a journey through Adani Wilmar's Risk and Solvency Analysis to decipher the signals guiding this edible oil and agri-processing giant.
1. Stock Beta - Riding the Low-Risk Currents:
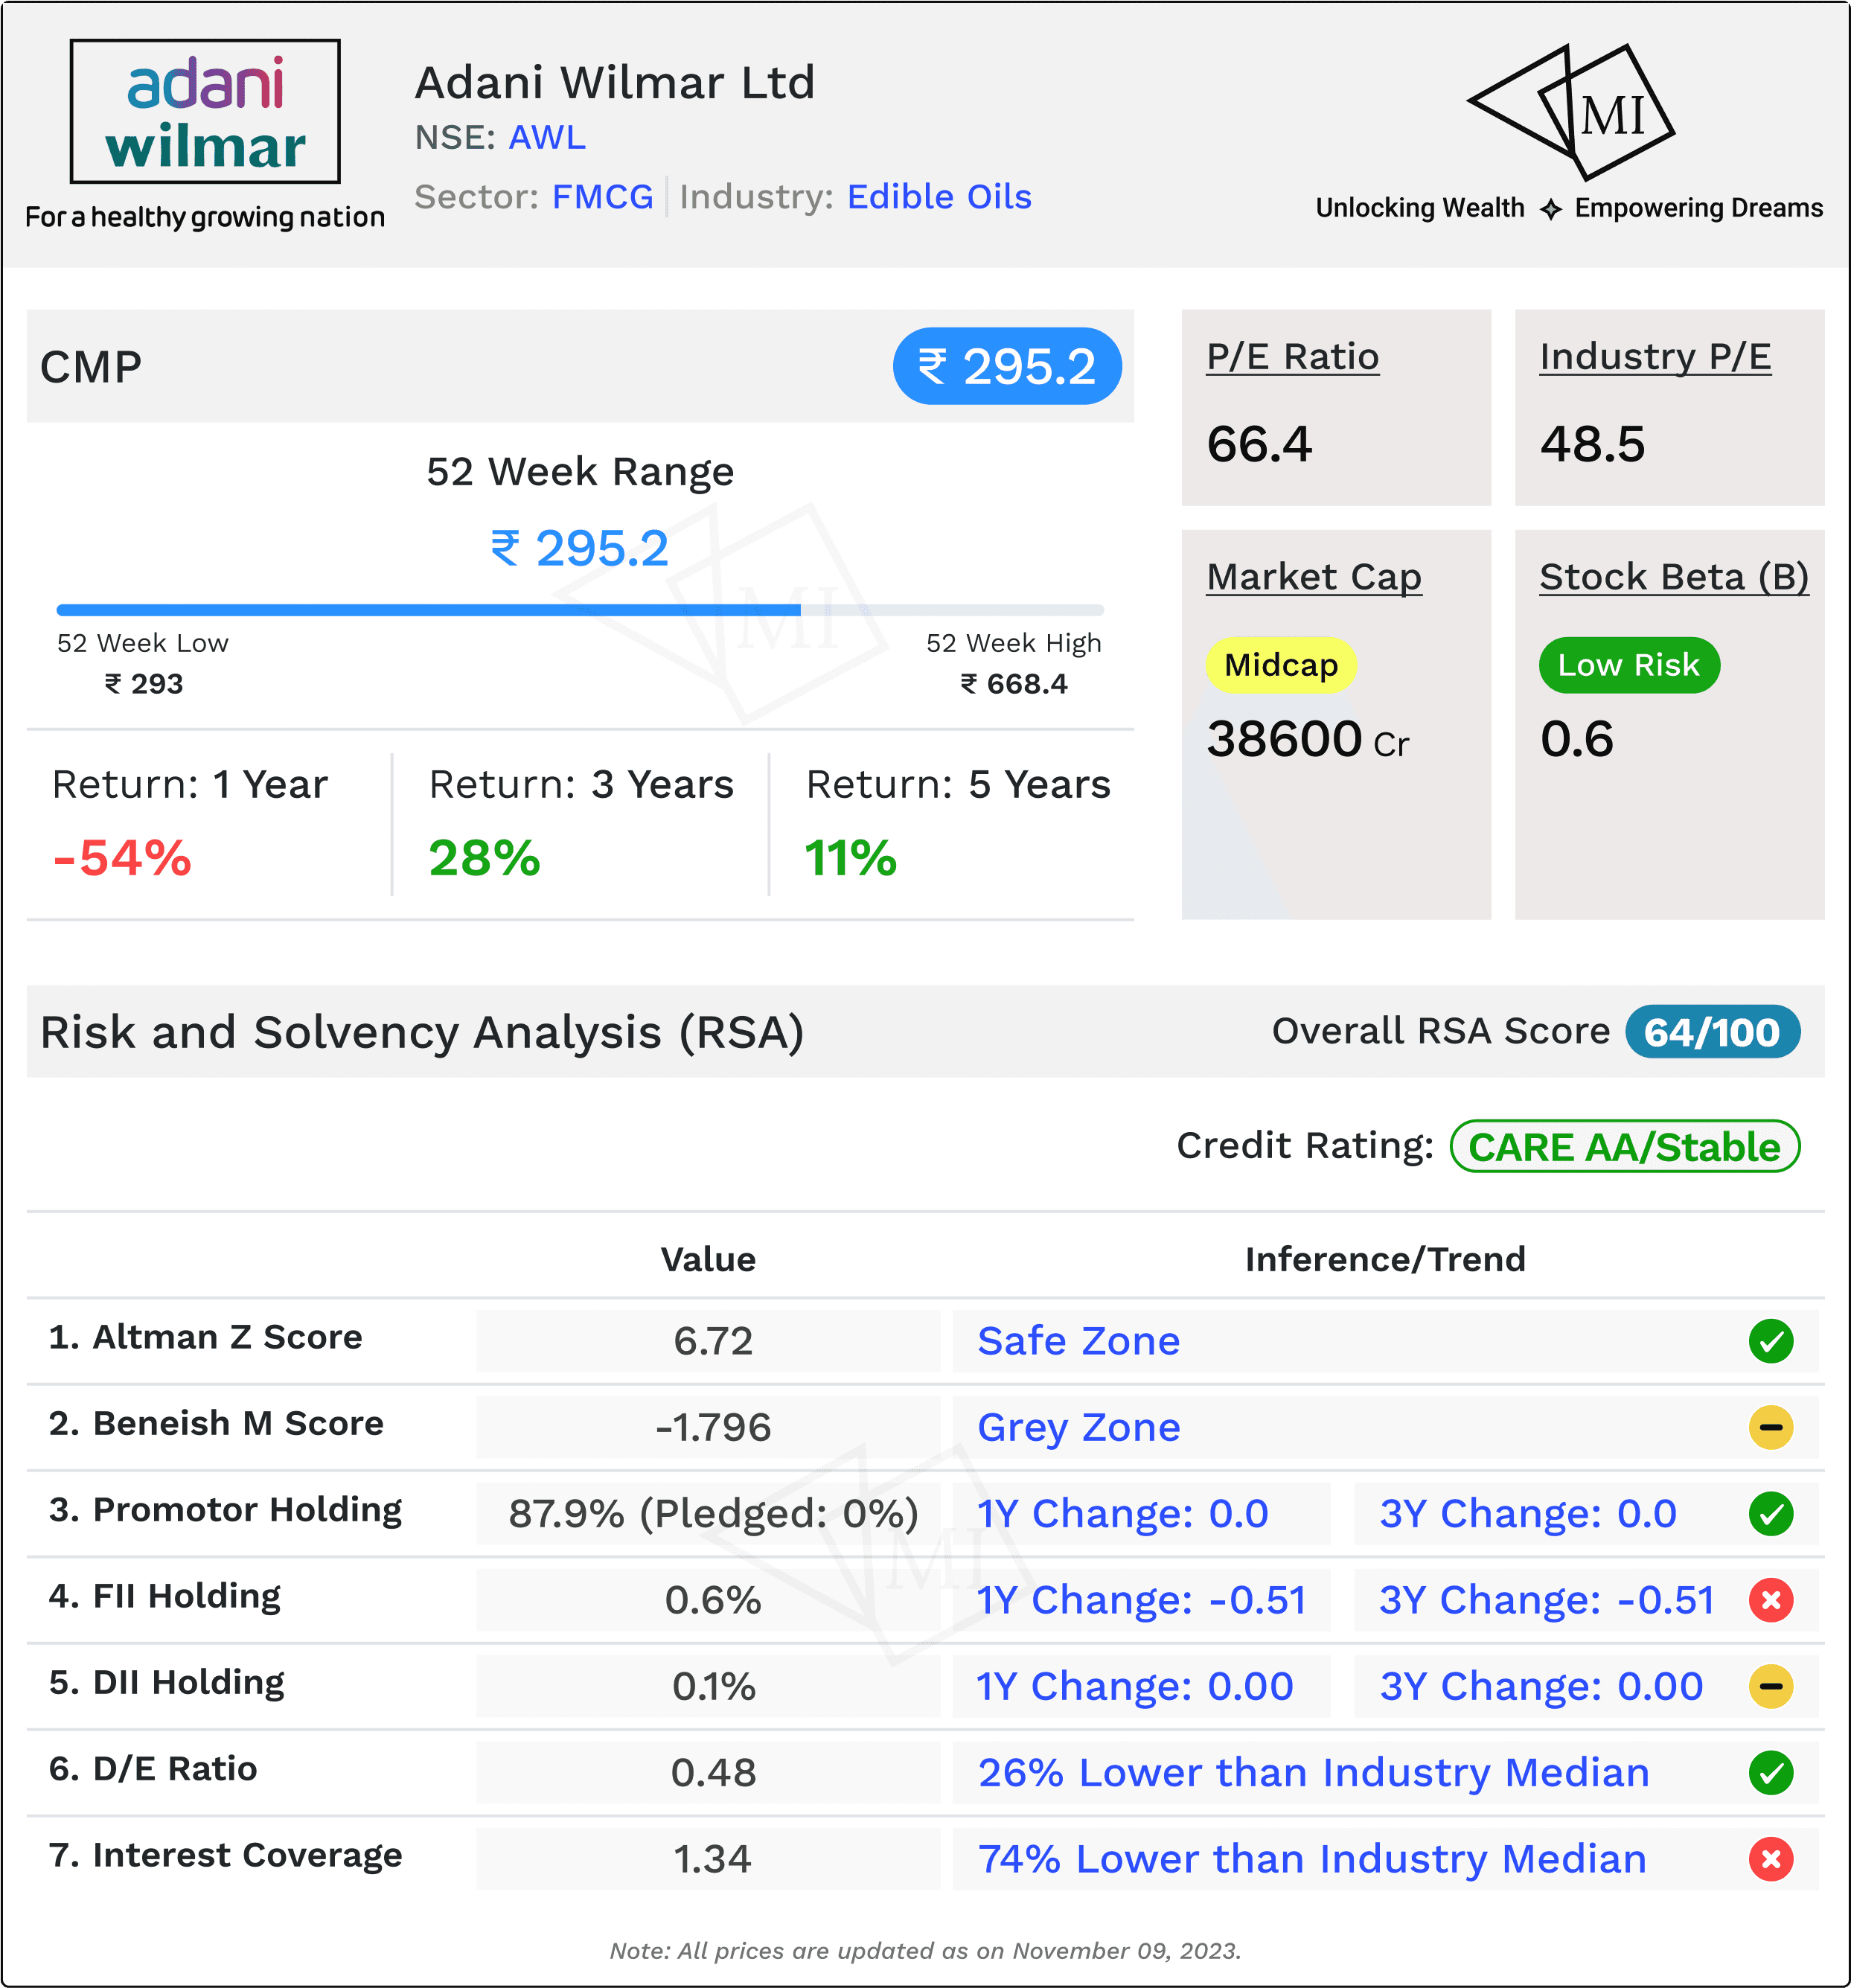
Adani Wilmar boasts a Stock Beta of 0.6, portraying a low-risk profile. This indicates that the stock is less volatile than the market, offering investors a more stable journey amid market fluctuations.
2. Long-Term Credit Rating - A Pillar of Stability:
With a CARE AA-/Stable Long-Term Credit Rating, Adani Wilmar solidifies its financial standing. This rating suggests a high degree of creditworthiness and a stable outlook, providing a foundation of confidence for stakeholders.
3. Altman Z Score - Safeguarding Stability:
The Altman Z Score, standing at 6.72, comfortably places Adani Wilmar in the safe zone. This score, well above the threshold, signals a robust financial position and a lower likelihood of financial distress.
4. Beneish M Score - Navigating the Grey Zone:
Contrastingly, the Beneish M Score at -1.796 places the company in a grey zone. This score indicates a potential manipulation zone, urging investors to scrutinize financial statements and business practices more closely.
5. Promoter Holding - A Foundation of Trust:
Adani Wilmar enjoys a solid Promoter Holding of 87.9%, with no shares pledged. The consistent holding over 1 and 3 years signifies a promoter's unwavering belief in the company's potential, instilling trust among investors.
6. Institutional Holdings - A Conservative Approach:
Institutional holdings, with FII and DII holdings at 0.6% and 0.1%, respectively, reflect a conservative approach. The minimal changes over the years indicate a cautious stance from institutional investors.
7. D/E Ratio and ICR - Balancing Act in Progress:
Adani Wilmar maintains a healthy Debt-to-Equity (D/E) Ratio of 0.48, demonstrating prudent financial management and standing 26% lower than the industry median. However, the Interest Coverage Ratio (ICR) at 1.34 raises caution, being 74% lower than the industry median. This signals a need for careful monitoring of debt obligations.
In conclusion, Adani Wilmar navigates the market waters with a commendable low-risk stock, a stable credit rating, and a robust Altman Z Score. The grey zone in the Beneish M Score, though, suggests a need for vigilant scrutiny. With a strong promoter holding and conservative institutional approach, the company strikes a balance between stability and caution. The D/E ratio indicates responsible financial management, but the lower ICR warrants close attention to debt servicing capabilities.
Summary and Conclusion: Recap and Final Thoughts on Adani Wilmar
As we draw the curtains on the analysis of Adani Wilmar, a conglomerate in the edible oil and agri-processing sector, the amalgamation of financial metrics paints a vivid picture. Let's unravel the intricacies encapsulated in the scores and bring forth a comprehensive summary.
1. Financial Resilience - A Balancing Act:
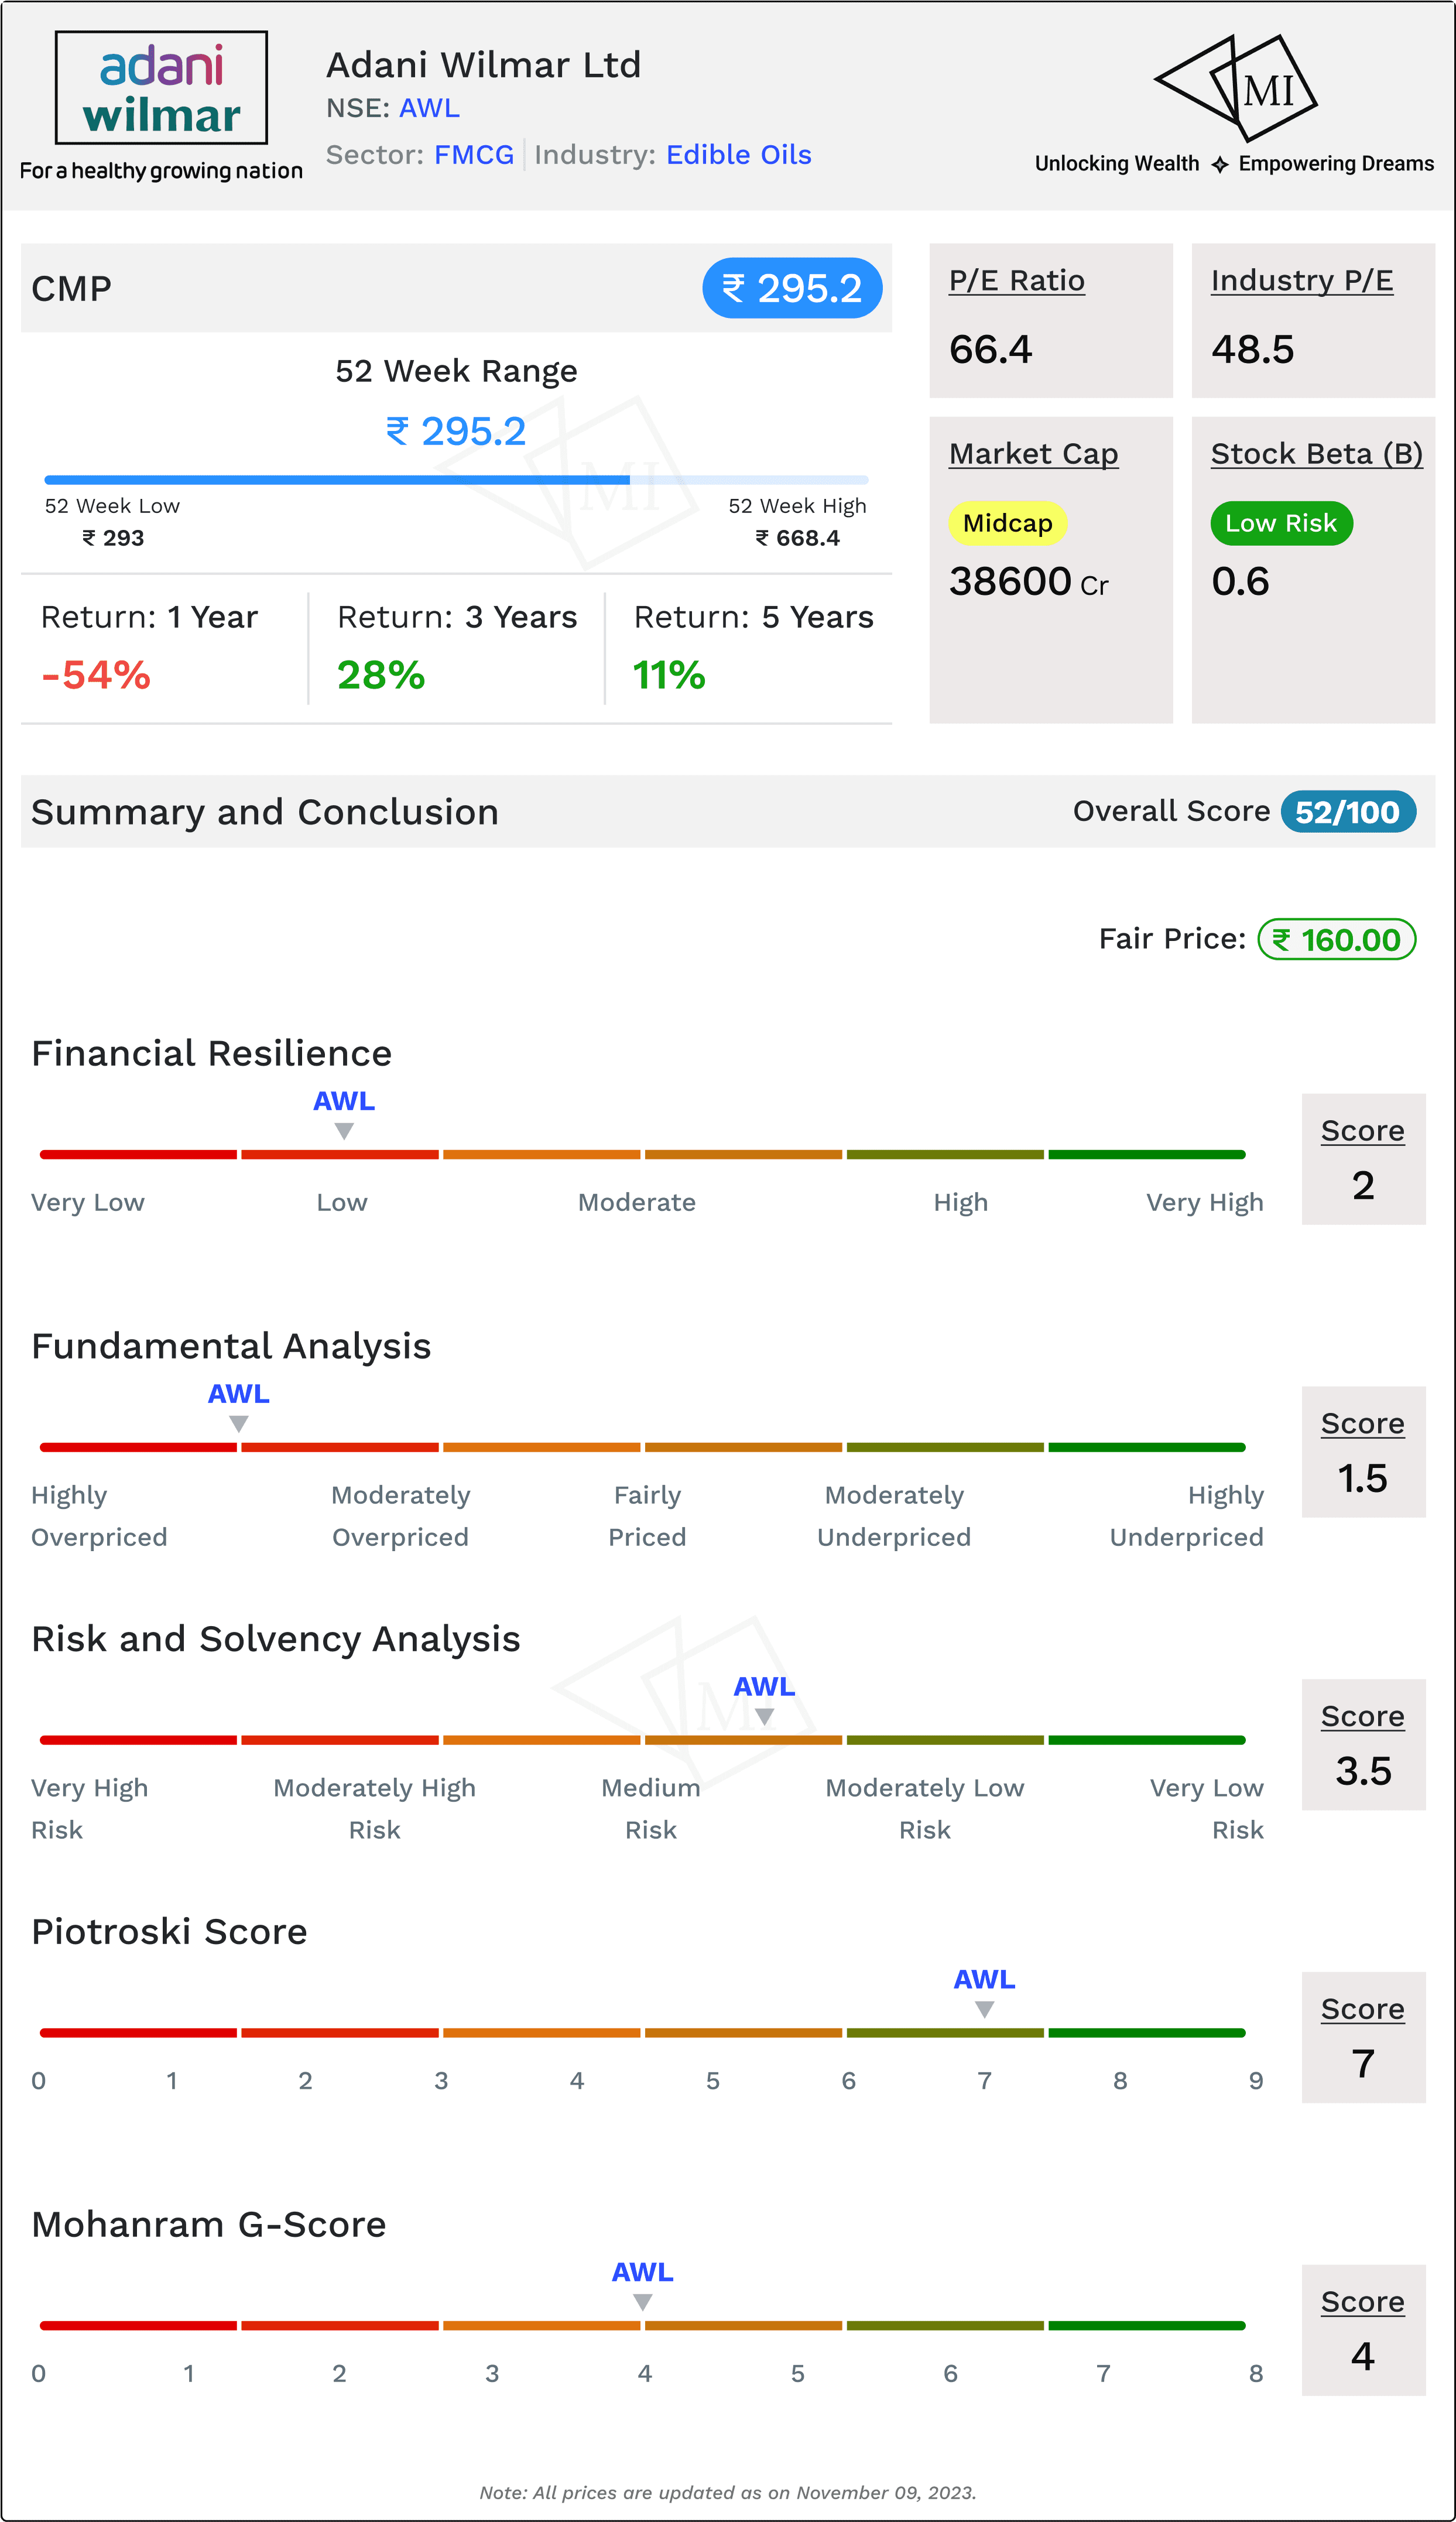
Adani Wilmar, with a Financial Resilience Score of 2 on 5, hints at a company navigating the market currents with a degree of caution. This score underscores the need for vigilance in financial strategies and a continuous evaluation of the economic landscape.
2. Fundamental Analysis - A Call for Scrutiny:
With a Fundamental Analysis Score of 1.5 on 5, the company signals areas of concern in its fundamental metrics. Investors are urged to scrutinize aspects like earnings growth, profitability, and market positioning, considering the potential impact on long-term value.
3. Risk and Solvency - A Sturdy Foundation with Cautions:
Adani Wilmar displays resilience in risk management with a Risk and Solvency Analysis Score of 3.5 on 5. This reflects a balanced approach to risk, leveraging low stock beta and a stable credit rating. However, the Beneish M Score's grey zone necessitates a discerning eye on financial nuances.
4. Piotroski Score - Scaling Heights:
The Piotroski Score, standing at 7, marks Adani Wilmar in the high category. This score underscores the company's adeptness in areas such as profitability, leverage, and operating efficiency, portraying a commendable operational and financial health.
5. Mohanram G-Score - A Middling Tune:
The Mohanram G-Score of 4, falling in the average spectrum, signals a balanced performance. While the score doesn't soar to remarkable heights, it also doesn't plunge into concerning territories. Investors may find reassurance in this moderate assessment.
Overall Symphony - Balancing Scores on a Scale of 100:
As we merge these scores into an overarching assessment, Adani Wilmar secures an Overall Score of 52 on 100. This confluence of financial, fundamental, and risk metrics provides investors with a comprehensive snapshot, urging a nuanced consideration of the company's position in the market.
Fair Price Evaluation - A Tale of Numbers:
The fair price for Adani Wilmar's stock, calculated at INR 160, stands in stark contrast to the current market price of INR 295.2. This delta between fair value and market price beckons investors to contemplate the intricacies that contribute to this valuation dissonance.
In conclusion, Adani Wilmar's melody in the market is one of balanced resilience, marked by notable highs in Piotroski Score, tempered by caution in certain fundamental aspects.
Information on Multibagger Investments is for educational purposes only and should not be considered financial advice. Users should conduct their own research and seek professional advice before making investment decisions.
Frequently Asked Questions
संबंधित लेख

157% Return in 3 Years. Is IDFC First Bank share good to buy for long term?
22% Return in 3 Years. Is Yes Bank share worth buying?
