Nearing 52 Week High Mark. Is Zomato share worth buying?


Introduction
Founded in 2010, Zomato Limited has emerged as a premier online Food Service platform globally, boasting a comprehensive range of services from food delivery to dining-out experiences and loyalty programs. With a substantial presence across 23 countries, Zomato stands out with 131,233 active food delivery restaurants, 161,637 delivery partners, and an average monthly food order volume of 10.7 million customers as of December 31, 2020.
Key Points:
Zomato is a frontrunner in the Indian food service industry, attracting 32.1 million average Monthly Active Users in FY21 and listing 389,932 active restaurants as of March 31, 2021. The mobile application, a leader in downloads, witnesses around 90 billion monthly visits in FY23. With an extensive footprint in 1000+ cities, Zomato is setting new benchmarks in the evolving landscape of food services. The business operates in three main segments: Food Delivery, Dining Out, and Hyper Pure.
Business Segments:
- Food Delivery: Zomato's food delivery segment has experienced remarkable growth, with orders surging from 30.6 million in FY18 to 403.1 million in FY20. In FY22, the platform delivered orders worth Rs 213 billion across 535.2 million orders, with an average order value of approximately Rs 398. The active monthly transaction rate reached 17.5 million in Q2FY23, with 207,000 active food delivery restaurant partners and 341,000 active delivery partners.
- Dining Out: Zomato's dining-out offerings empower customers to explore, review, and book tables at restaurants. Revenue, primarily generated through advertising sales products, declined by 15% YoY in FY22 due to the focus on the Indian market.
- Hyper Pure: Zomato's Hyper Pure segment revolutionizes restaurant supply chains by sourcing quality ingredients directly from farmers, mills, producers, and processors. With 40,000 unique restaurants billed as of Q2FY23, Hyper Pure plays a pivotal role in enhancing the efficiency of restaurant supply chains.
Zomato's dynamic approach to the food service industry positions it as a trailblazer, combining innovation, extensive reach, and a diversified service portfolio.
Growth, Profitability, and Efficiency (GPE) Analysis of Zomato
Investors keen on understanding a company's long-term viability often turn to a comprehensive Growth, Profitability, and Efficiency (GPE) analysis. This examination sheds light on a company's ability to grow its revenue, generate profits, and efficiently manage its resources. In this context, let's delve into Zomato's GPE metrics to gain insights into its financial performance.
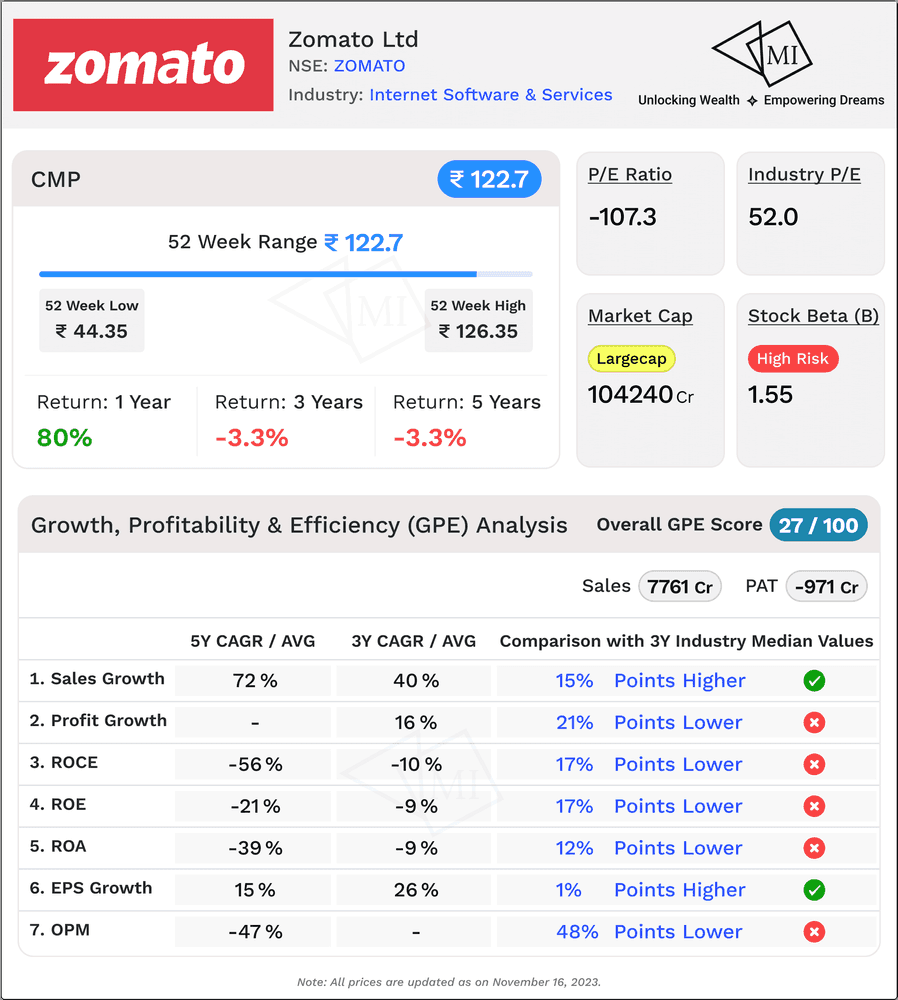
1. Sales Growth: Impressive Trajectory
Zomato's sales growth has been a standout feature, with a 3-year Compound Annual Growth Rate (CAGR) of 40%, surpassing its peers by a substantial 15%. The 5-year CAGR is an astounding 72%, a remarkable 57% higher than the median of its peers. This robust growth trajectory underscores Zomato's market dominance and its successful expansion strategies.
2. Profits: Room for Improvement
Despite strong sales growth, Zomato's profitability metrics tell a nuanced story. The 3-year CAGR for profits stands at 16%, lagging behind the median of its peers by 21%. While Zomato demonstrates profitability, there's a notable gap compared to industry peers. This indicates potential areas for improvement in cost management and operational efficiency.
3. Return on Capital Employed (ROCE): A Challenge
Zomato faces challenges in capital efficiency, as evidenced by its 3-year average ROCE of -10%, trailing 17% behind its peers. The 5-year average ROCE is even more concerning at -56%, a substantial 61% lower than the peer median. Improving capital utilization efficiency will be crucial for Zomato to enhance investor confidence and sustainable growth.
4. Return on Equity (ROE) and Return on Assets (ROA): Seeking a Turnaround
Zomato's 3-year and 5-year average ROE and ROA are negative, reflecting challenges in generating returns for shareholders and efficiently using assets. The 3-year ROE is 17% lower than the peer median, and the 5-year ROE is 22% lower. Similar trends are observed in ROA, with Zomato trailing by 12% and 40% in the 3-year and 5-year averages, respectively. Addressing these negative trends is critical for building investor confidence.
5. Earnings Per Share (EPS): Steady Growth
On a positive note, Zomato exhibits steady growth in earnings per share (EPS). The 3-year EPS growth of 26% and 5-year growth of 15% are both 1% higher than the peer median. This indicates that, despite profitability challenges, Zomato is managing to grow earnings on a per-share basis, which can be a positive signal for investors.
6. Operating Margin: Room for Improvement
Zomato faces challenges in maintaining a positive operating margin, with a 5-year average of -47%. This is 48% lower than the median of its peers. Improving operational efficiency and cost management will be key to achieving a healthier bottom line.
In conclusion, while Zomato has showcased exceptional sales growth and steady EPS expansion, challenges in profitability and capital efficiency signal areas for improvement. Investors should closely monitor Zomato's strategies to address these challenges and navigate the evolving landscape of the food delivery industry. As the company continues to innovate and refine its operations, its ability to turn growth into sustainable profitability will be a key factor in determining its long-term success.
Fundamental Analysis (FA) of Zomato
Investors often turn to fundamental analysis to decipher the intrinsic value of a stock and make informed decisions. Let's embark on a journey through various fundamental metrics to assess Zomato's current market standing and its potential trajectory.
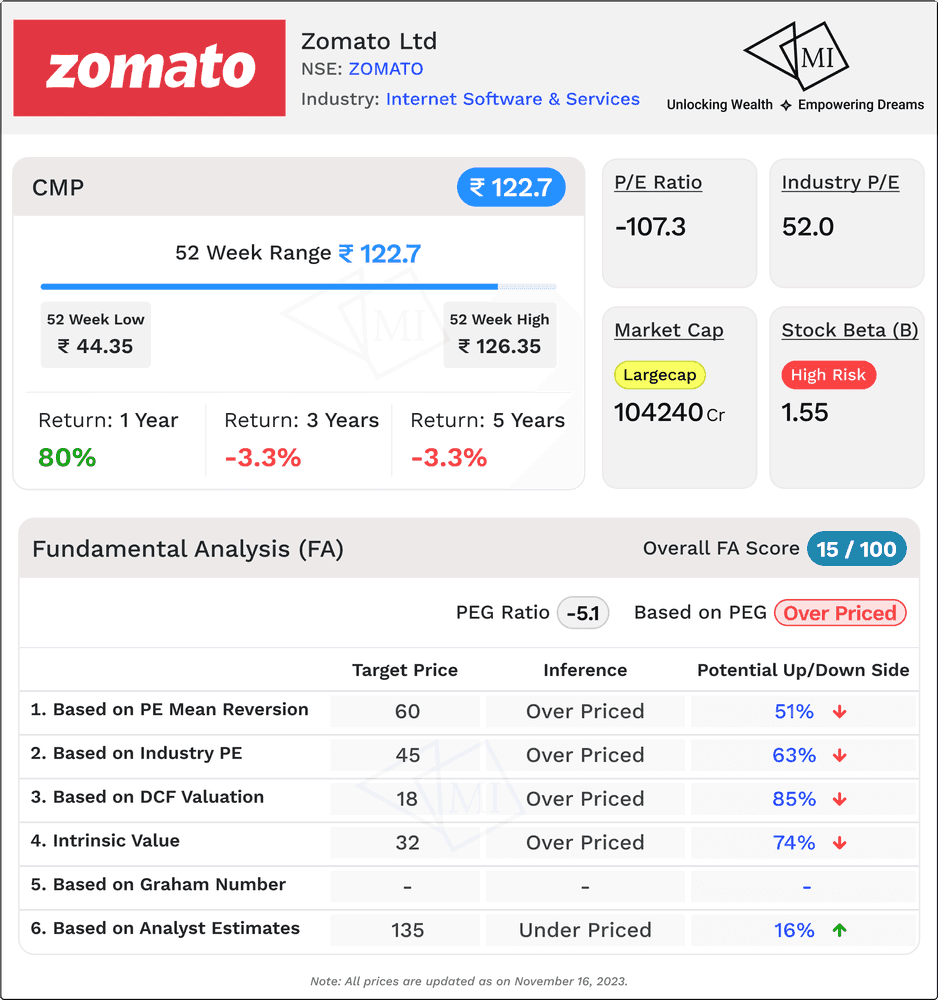
1. Current Market Price and PEG Ratio: A Snapshot
As of the latest available data, Zomato's market price stands at INR 122.7, and its Price/Earnings to Growth (PEG) ratio is -5.1. The negative PEG ratio suggests the stock might be overpriced, indicating a potential concern for investors.
2. Expected Share Price based on PE Mean Reversion: INR 60
Utilizing the Price/Earnings (PE) mean reversion approach, the expected share price for Zomato is estimated to be INR 60, signaling a potential downside of 51%. This projection implies that the stock is currently overpriced and could see a correction.
3. Expected Share Price based on Industry PE: INR 45
Considering the industry's average PE ratio, the anticipated share price for Zomato is INR 45, indicating a potential downside of 63%. This analysis reinforces the notion that the stock might be overvalued compared to its industry peers.
4. Fair Value as per DCF Valuation (Base Case Scenario): INR 18
A discounted cash flow (DCF) valuation in a base-case scenario for Zomato reveals a fair value of INR 18, suggesting a substantial potential downside of 85%. This emphasizes the need for a cautious approach, as per the DCF valuation.
5. Intrinsic Value (Base Case Scenario): INR 32
The intrinsic value analysis for Zomato, based on fundamental factors, points to an intrinsic value of INR 32. This implies a potential downside of 74%, reinforcing the idea that the stock might be overpriced.
6. Target Price as per Analyst Estimate: INR 135
Contrary to some other fundamental indicators, analyst estimates suggest a target price for Zomato at INR 135, indicating a potential upside of 16%. It's crucial to consider these estimates, though they often vary and are subject to change based on market dynamics and company performance.
7. Fair Value as per Graham Number: NA (Negative EPS)
The Graham Number couldn't be estimated due to negative earnings per share (EPS). This underscores the challenges Zomato faces in terms of profitability, which is a critical aspect of fundamental analysis.
Conclusion: Navigating Uncertain Waters
Fundamental analysis paints a mixed picture for Zomato's share price. While some estimates, like the analyst target price, suggest potential upside, others, such as DCF valuation and intrinsic value, point to a significant downside.
Risk and Solvency Analysis (RSA) of Zomato
Investing in stocks involves a careful examination of risk and solvency factors that can significantly impact a company's stability and financial health. Let's delve into the risk and solvency analysis of Zomato to better understand the potential challenges and strengths inherent in the company's financial structure.
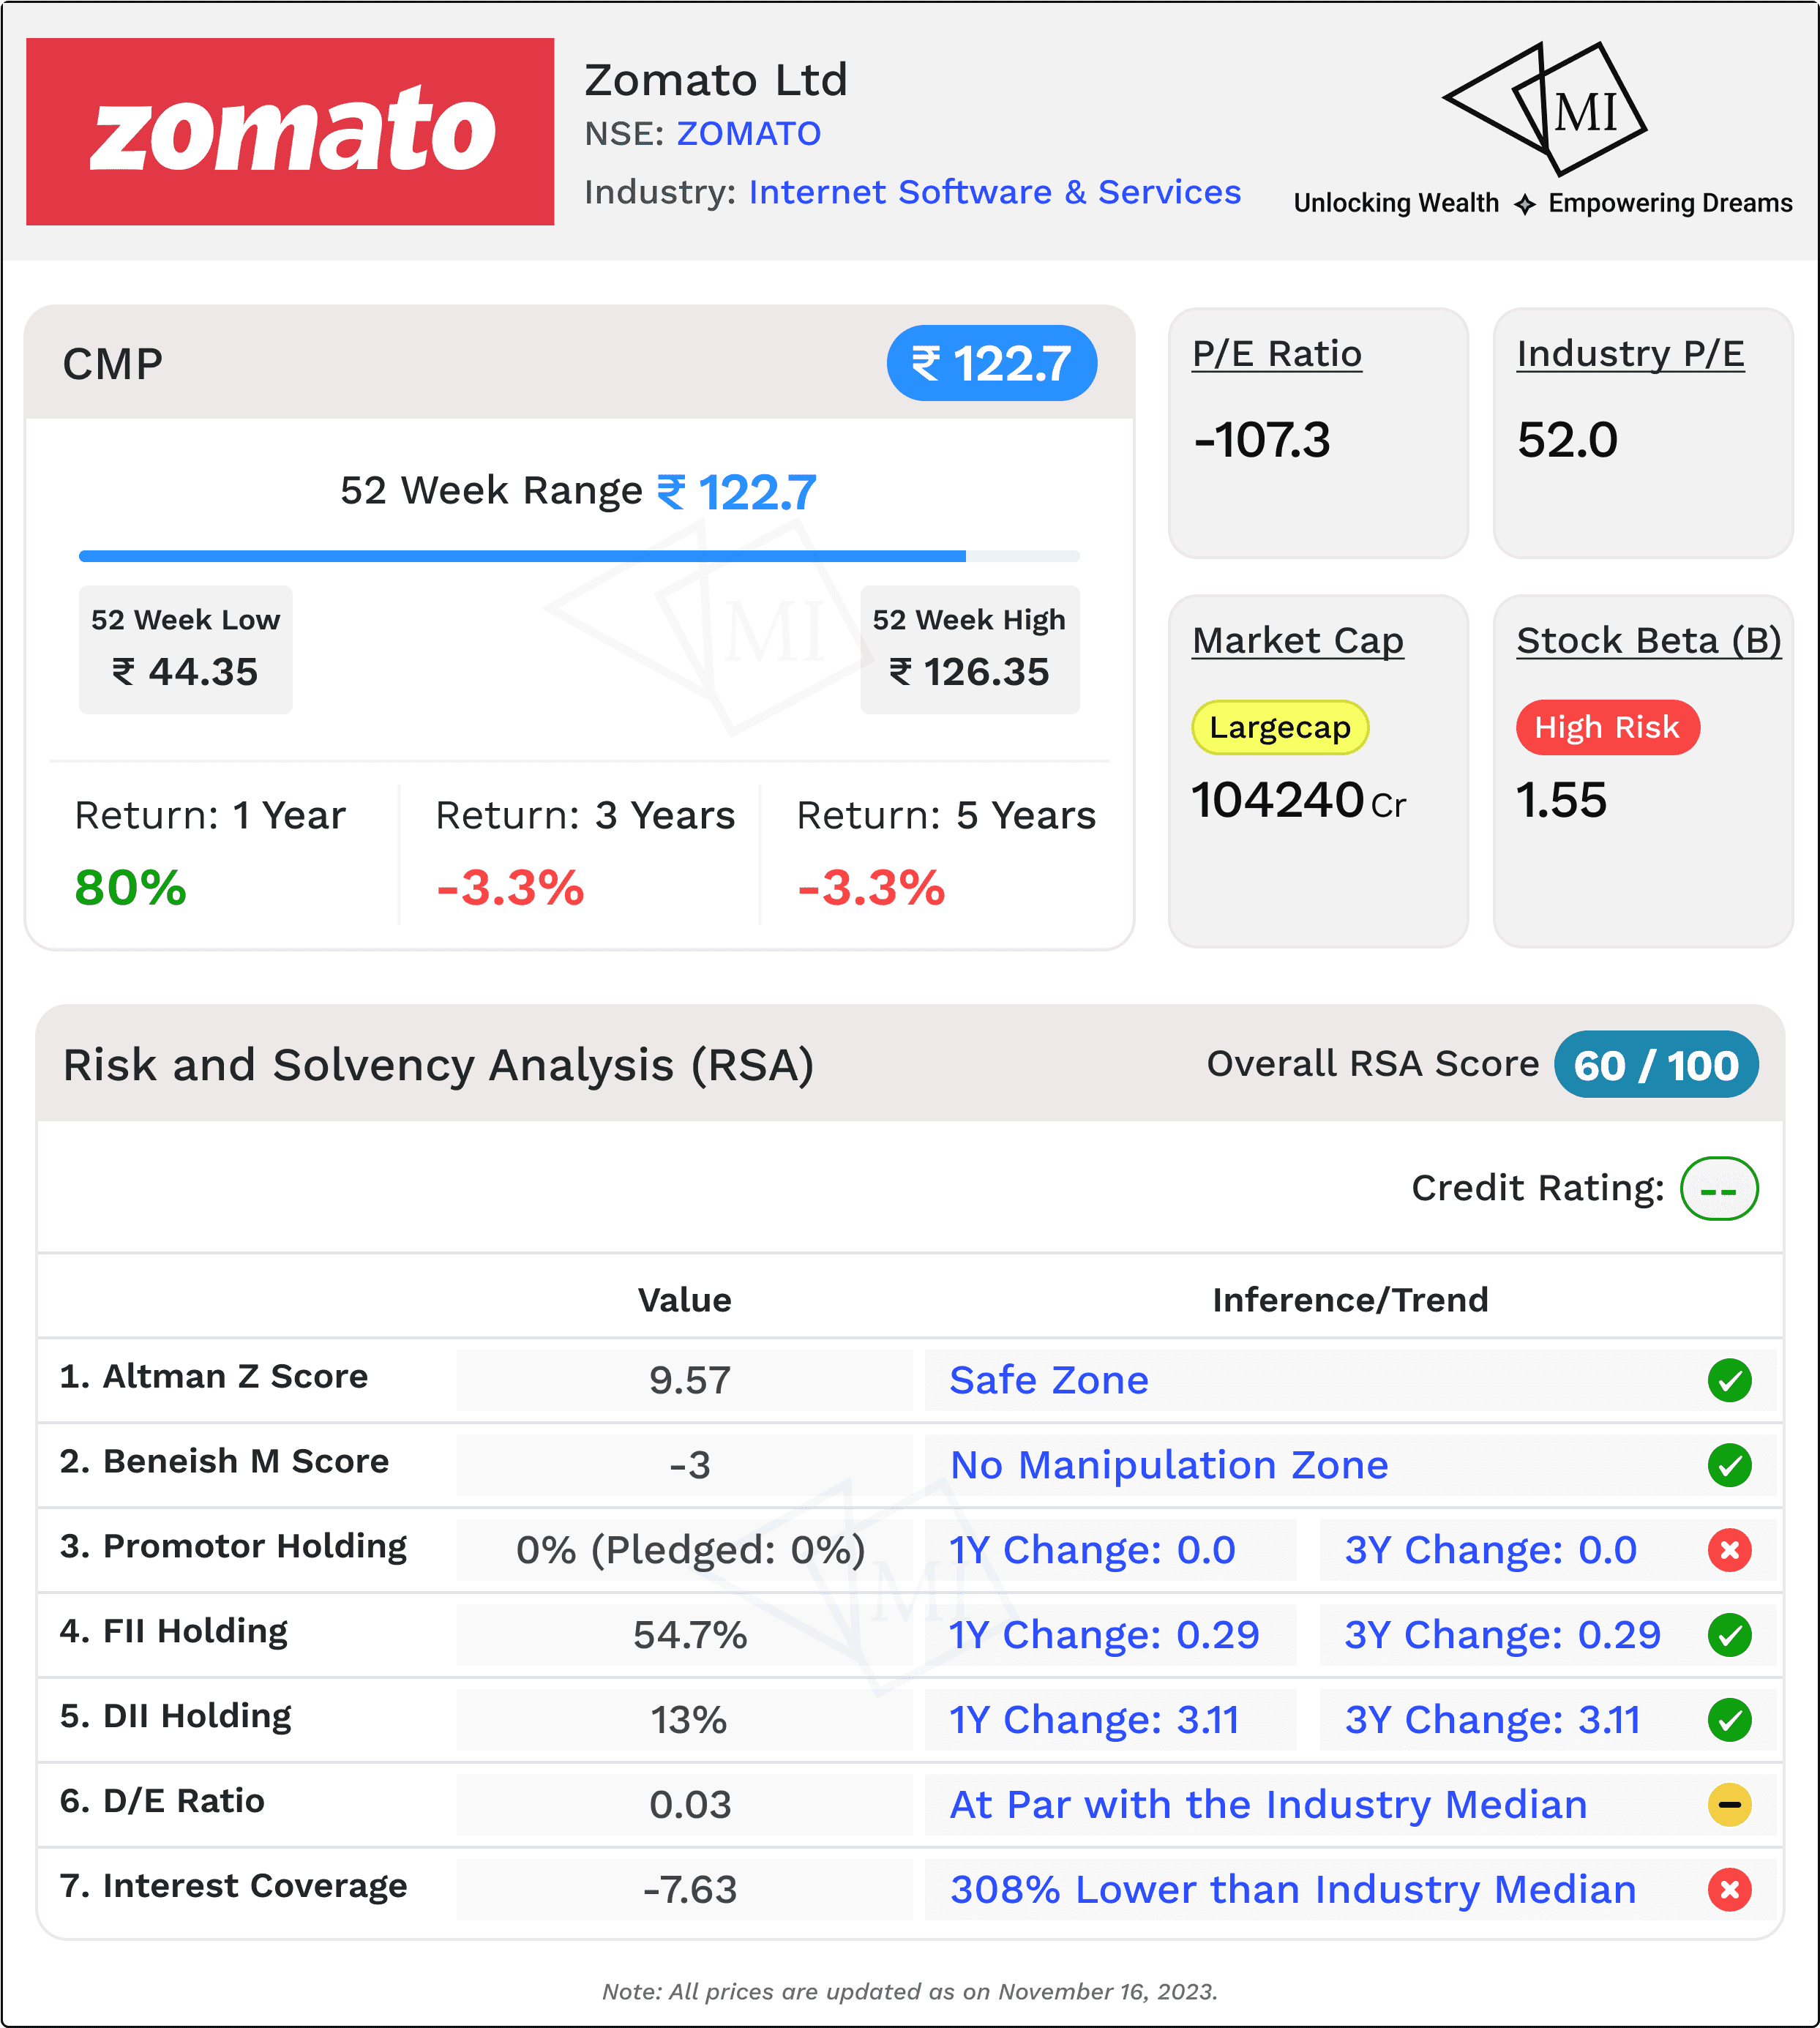
1. Stock Beta: 1.55 (Signifies High Risk)
Zomato's stock beta of 1.55 indicates a higher level of risk compared to the market. A beta above 1 implies that the stock is expected to be more volatile than the market. Investors seeking high returns should be prepared for higher fluctuations in the stock's value.
2. Altman Z Score: 9.57 (Safe Zone)
The Altman Z Score, standing at 9.57, positions Zomato in the safe zone. This score, well above the threshold, suggests a low risk of bankruptcy. Investors often rely on the Altman Z Score to assess a company's financial health and the likelihood of financial distress.
3. Beneish M Score: -3 (No Manipulation Zone)
With a Beneish M Score of -3, Zomato is in the "No Manipulation Zone." This suggests a lower likelihood of financial statement manipulation. A negative M Score indicates a lower chance of earnings manipulation, providing a level of assurance for investors.
4. Promoter, FII, and DII Holdings: Stability and Institutional Support
Promoter Holding: 0% (Unchanged Over 1Y and 3Y, 0% Pledged)
The absence of promoter holding might raise questions about the level of commitment and alignment of interests with shareholders.
FII Holding: 54.7% (Stable Over 1Y and 3Y)
Foreign Institutional Investors (FIIs) holding a significant stake can provide stability to the stock. The stable FII holding over both one and three years signals confidence in Zomato's prospects.
DII Holding: 13% (Increased Over 1Y and 3Y)
An increase in Domestic Institutional Investors (DIIs) holding over the past year and three years indicates growing interest from domestic institutional players.
5. D/E Ratio: 0.03 (At Par with the Industry Median Value)
Zomato's Debt-to-Equity (D/E) ratio of 0.03 is at par with the industry median. A low D/E ratio suggests lower financial risk and indicates that Zomato relies less on debt for its financing, potentially providing a more stable financial structure.
6. Interest Coverage Ratio (ICR): -7.63 (308% Lower than Industry Median Value of 3.66)
The Interest Coverage Ratio (ICR) at -7.63 is significantly lower than the industry median, indicating potential challenges in meeting interest obligations. Investors should closely monitor the company's ability to service its debt.
Conclusion: Balancing Risks and Strengths
Zomato's risk and solvency analysis present a nuanced picture. While the Altman Z Score and Beneish M Score indicate a relatively secure financial position, the high beta and negative ICR raise concerns. Investors should carefully weigh the risk factors against the company's growth potential and industry dynamics.
Summary and Conclusion: Recap and Final Thoughts on Zomato
In the intricate world of stock markets, deciphering the future trajectory of a company's share price requires a comprehensive analysis of various facets. Let's distill the key insights from Zomato's financial journey and arrive at a conclusion that investors can ponder upon.
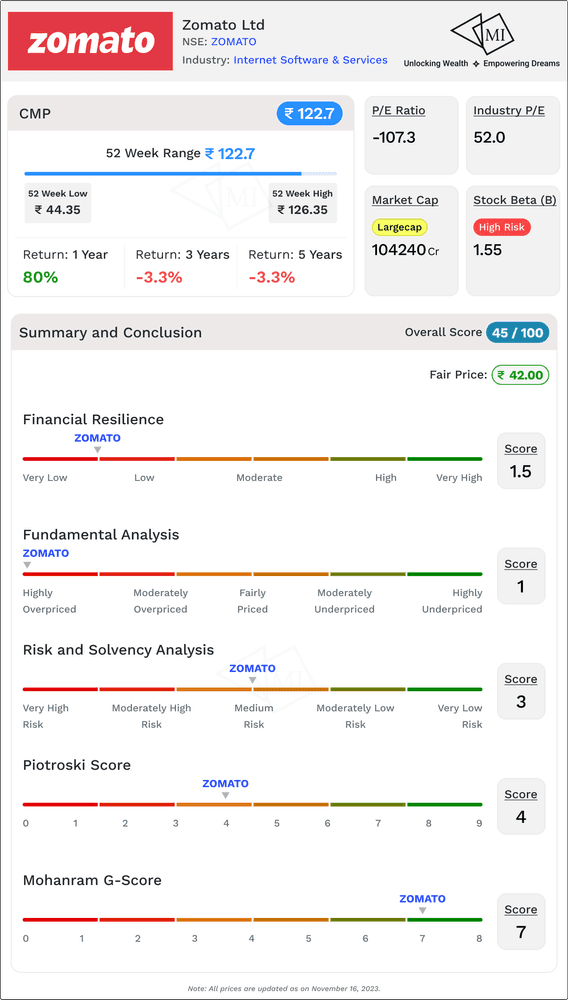
1. Financial Resilience Score: 1.5 on 5
Zomato's financial resilience, as depicted by its Financial Resilience Score of 1.5 on 5, points to a challenging scenario. While the company showcases certain strengths, it also grapples with financial intricacies that could pose hurdles in the pursuit of sustained growth.
2. Fundamental Analysis Score: 1 on 5
The Fundamental Analysis Score of 1 on 5 suggests a delicate financial fabric for Zomato. While the company exhibits growth in sales and earnings, the profitability and efficiency metrics signal potential areas for improvement.
3. Risk and Solvency Analysis Score: 3 on 5
Zomato's Risk and Solvency Analysis Score of 3 on 5 is indicative of a company navigating a landscape with both challenges and opportunities. Institutional interest, lack of promoter holding, and a moderate Debt-to-Equity ratio contribute to a mixed risk profile.
4. Piotroski Score: 4 (Average)
The Piotroski Score of 4 categorizes Zomato's financial health as average. While the company demonstrates certain positive signs, the score implies room for enhancement in certain fundamental aspects.
5. Mohanram G-Score: 7 (High)
A Mohanram G-Score of 7 positions Zomato in a relatively favourable light. This score, indicative of a high financial quality, is a testament to the company's performance on various financial metrics.
Overall Score: 45 on 100, Fair Price for Stock: INR 42
As we amalgamate these diverse scores into an overall perspective, Zomato attains an Overall Score of 45 on 100. The fair price for the stock, considering this analysis, is estimated at INR 42. However, the current market price is notably higher at INR 122.7
Conclusion: Navigating the Crossroads
In the intricate tapestry of Zomato's financial journey, investors find themselves at a crossroads. While certain metrics showcase promise, others raise cautionary flags. The company's resilience in the face of challenges, coupled with its growth potential, is juxtaposed against concerns related to profitability and risk factors.
The stark contrast between the fair price estimation and the current market price of 122.7 prompts investors to tread cautiously. It's a call for a meticulous evaluation of the risk appetite, a thorough understanding of the industry dynamics, and a keen eye on the evolving narrative of the food delivery sector.
Information on Multibagger Investments is for educational purposes only and should not be considered financial advice. Users should conduct their own research and seek professional advice before making investment decisions.